
There are two possible outcomes: if the result confirms the hypothesis, then you've made a measurement. If the result is contrary to the hypothesis, then you've made a discovery - Enrico Fermi
Life is wonderful because it is made of discovery.
And to me, that is exactly the point of analysis. Analysis is not about confirming the hypothesis you started with. The real pleasure comes when the evidence forces you to change your mind, when the result contradicts what you expected and reveals something you had not seen before.
I have spent my entire professional life analyzing businesses, partly out of passion, partly as a business executive and educator. What has always fascinated me is going beneath the surface to understand the structural patterns that explain what is actually happening.
That is where analysis becomes discovery.
This is where I stand.
NVIDIA’s Q2 print just came out, and to me it is the epitome of the Map of AI.
The Map of AI is my most rigorous attempt to track where we actually are in the AI Supercycle. Not where the hype says we are. Not where the skeptics want us to be. But where the underlying system is moving.
Because the real question is structural, and answering it requires nuance.
AI has become so divisive and politicized that most of the debate has collapsed into two camps. On one side, AI is snake oil: a speculative bubble, socially destructive, and largely a scam. On the other, AI is treated almost as an article of faith: the technology will transform everything, therefore every investment, company, and narrative attached to it must somehow be justified.
Neither position is analytical. And neither is particularly useful.
They do not help us understand what is actually happening, where value is accumulating, where bottlenecks are forming, what is durable, what is temporary, and where genuine excess is beginning to emerge.
I subscribe to neither camp.
My job as an analyst is to deconstruct the system. To separate structural change from speculation, infrastructure from narrative, durable economics from temporary scarcity, and technological transformation from financial excess.
If the AI Supercycle moves into genuine bubble territory, you will hear it from me.
If the evidence instead shows that AI is becoming one of the most consequential technological shifts of our generation, you will hear that too.
The objective is not to defend a thesis. It is to keep updating the map as reality changes.
The AI Supercycle is not simply the rise of better models, nor a software cycle that began with ChatGPT. It is the multi-decade buildout of a new computational infrastructure layer that is progressively reorganizing the economy around machine intelligence.
That buildout stretches from energy and physical infrastructure through semiconductor equipment, foundries, memory, silicon, networking, compute, models, routing, agentic systems, distribution and settlement. Capital moves down the stack to build the infrastructure; intelligence becomes cheaper and moves upward through it; applications create new demand; and that demand pulls another round of infrastructure behind it.
That is what makes this a supercycle rather than a normal technology cycle. A normal product cycle can often be understood through adoption: a technology appears, customers buy it, competitors enter, margins normalize. Here, software demand is forcing a reconstruction of the physical and financial layers beneath it, while falling intelligence costs continuously expand what can be built above it.
But there is not one smooth AI curve. The better mental model is one supercycle composed of many S-curves. Individual nodes overshoot, correct, refinance, commoditize or disappear while the larger system keeps climbing. A correction in one node is therefore not automatically a verdict on the cycle.
That distinction is the premise of this map.
The reading: 56 out of 100
Before the story, the reading.
On a six-gauge instrument measuring how the AI buildout is financed, money visible or hidden, self-funded or borrowed, taken out or trapped inside the system, the needle sits at 56 out of 100: stretched. Not calm, and not breaking.
The structure remains remarkably sound wherever you measure it in cash generation and increasingly fragile wherever you measure it in refinancing. There is effectively a hard stop at 70 that financing strain alone cannot cross. To push the system beyond it, something more fundamental has to fail: demand.
And this quarter, demand did not fail.
The dispersion matters more than the average. There is roughly a 70-point gap between the calmest and hottest readings across the instrument. Some nodes remain extraordinarily well funded; others are approaching the edge of their financing capacity. That spread is the finding.
So the useful question is no longer simply, Is AI a bubble? It is: where is the strain, who is financing whom, where are the durable rents, which rents are temporary, and through which joints would stress propagate if demand eventually did weaken?
Why 1999 and 1973 are the wrong master analogies
For most of the AI boom, the default historical comparison has been 1999. The logic is obvious: extraordinary valuations, enormous capital commitments, uncertain monetization and a technology whose long-term importance does not protect investors from paying too much for it.
1999 gets one thing right: a transformational technology and financial excess can coexist. The internet survived the dot-com crash. Many of the companies financed around it did not. But 1999 remains too software-centric for what is happening now.
The analogy increasingly surfacing in 2026 is 1973. That comparison has become more plausible as energy, inflation and physical infrastructure have moved toward the centre of the AI debate. Reuters Breakingviews, for example, explicitly compared the risk of an energy shock derailing AI investment with the stagflationary dynamics of the 1970s.
The argument is stronger than the dot-com comparison. AI infrastructure increasingly depends on electricity, grid access, cooling, HBM, advanced packaging, transformers, land and cheap enough capital. A sufficiently violent repricing of one of those inputs could attack both operating economics and the financing structures behind them.
But 1973 is still the wrong master analogy. It describes a mature technological system hit by an external resource shock. The cars already existed. The highways already existed. The industrial system was already built. Oil attacked the economics of operating it.
AI is in a different phase: the network itself is still being constructed. Compute is expanding, model architecture is changing, inference economics are collapsing, new application surfaces are emerging, sovereigns are becoming a major buyer, and the deepest physical layers continue to confirm the same underlying demand curve.
That does not make an energy or financing shock irrelevant. It makes 1973 a useful failure mechanism inside the supercycle, not the best description of the supercycle itself.
The stronger analogy is 1846 and the British railway mania. Railway investment approached 7% of British GDP. More track was authorized in two years than the country could absorb for decades. Capital ran far ahead of near-term returns. Speculation followed. Panics followed. Investors were ruined.
The railway was not.
The mania financed the network. The panics transferred ownership of it. The network survived and repriced the cost of distance for an entire economy.
Hold all three at once: the mania can be real, the financial losses can be real, and the infrastructure can still be transformative.
There is therefore a useful hierarchy among the analogies. 1999 explains valuation excess. 1973 explains one possible input shock. 1846 explains the supercycle itself.
There is one more reason the railway analogy matters. Out of that wreckage came financiers who reorganized and refinanced the infrastructure itself.
Keep that detail. It becomes the centre of the map.
The architecture: two stacks, one fence, three buyers
The AI Supercycle is no longer developing as one global stack. It is separating into two increasingly distinct industrial systems.
The US-anchored stack runs broadly from ASML to TSMC to Nvidia/AMD to the clouds to the labs. The China-anchored stack runs through SMIC, CXMT, Huawei and the Chinese open-weight ecosystem, with memory one of the thinner points in the geopolitical fence between them.
Governance is therefore not another layer sitting on top. Governance is the fence around the stack. Export controls, deemed-export rules, data residency, antitrust and sovereignty cut horizontally through alliances and supply chains. Sovereign programs in Korea, Japan and Europe and Gulf capital through actors such as G42 and HUMAIN make that increasingly visible.
And demand now comes from three buyers rather than one: hyperscalers, enterprises and the state. The third matters because sovereign demand can be return-insensitive. It can establish a floor under strategic compute even when commercial returns would not justify the investment.
But a floor is not the same thing as a hurdle.
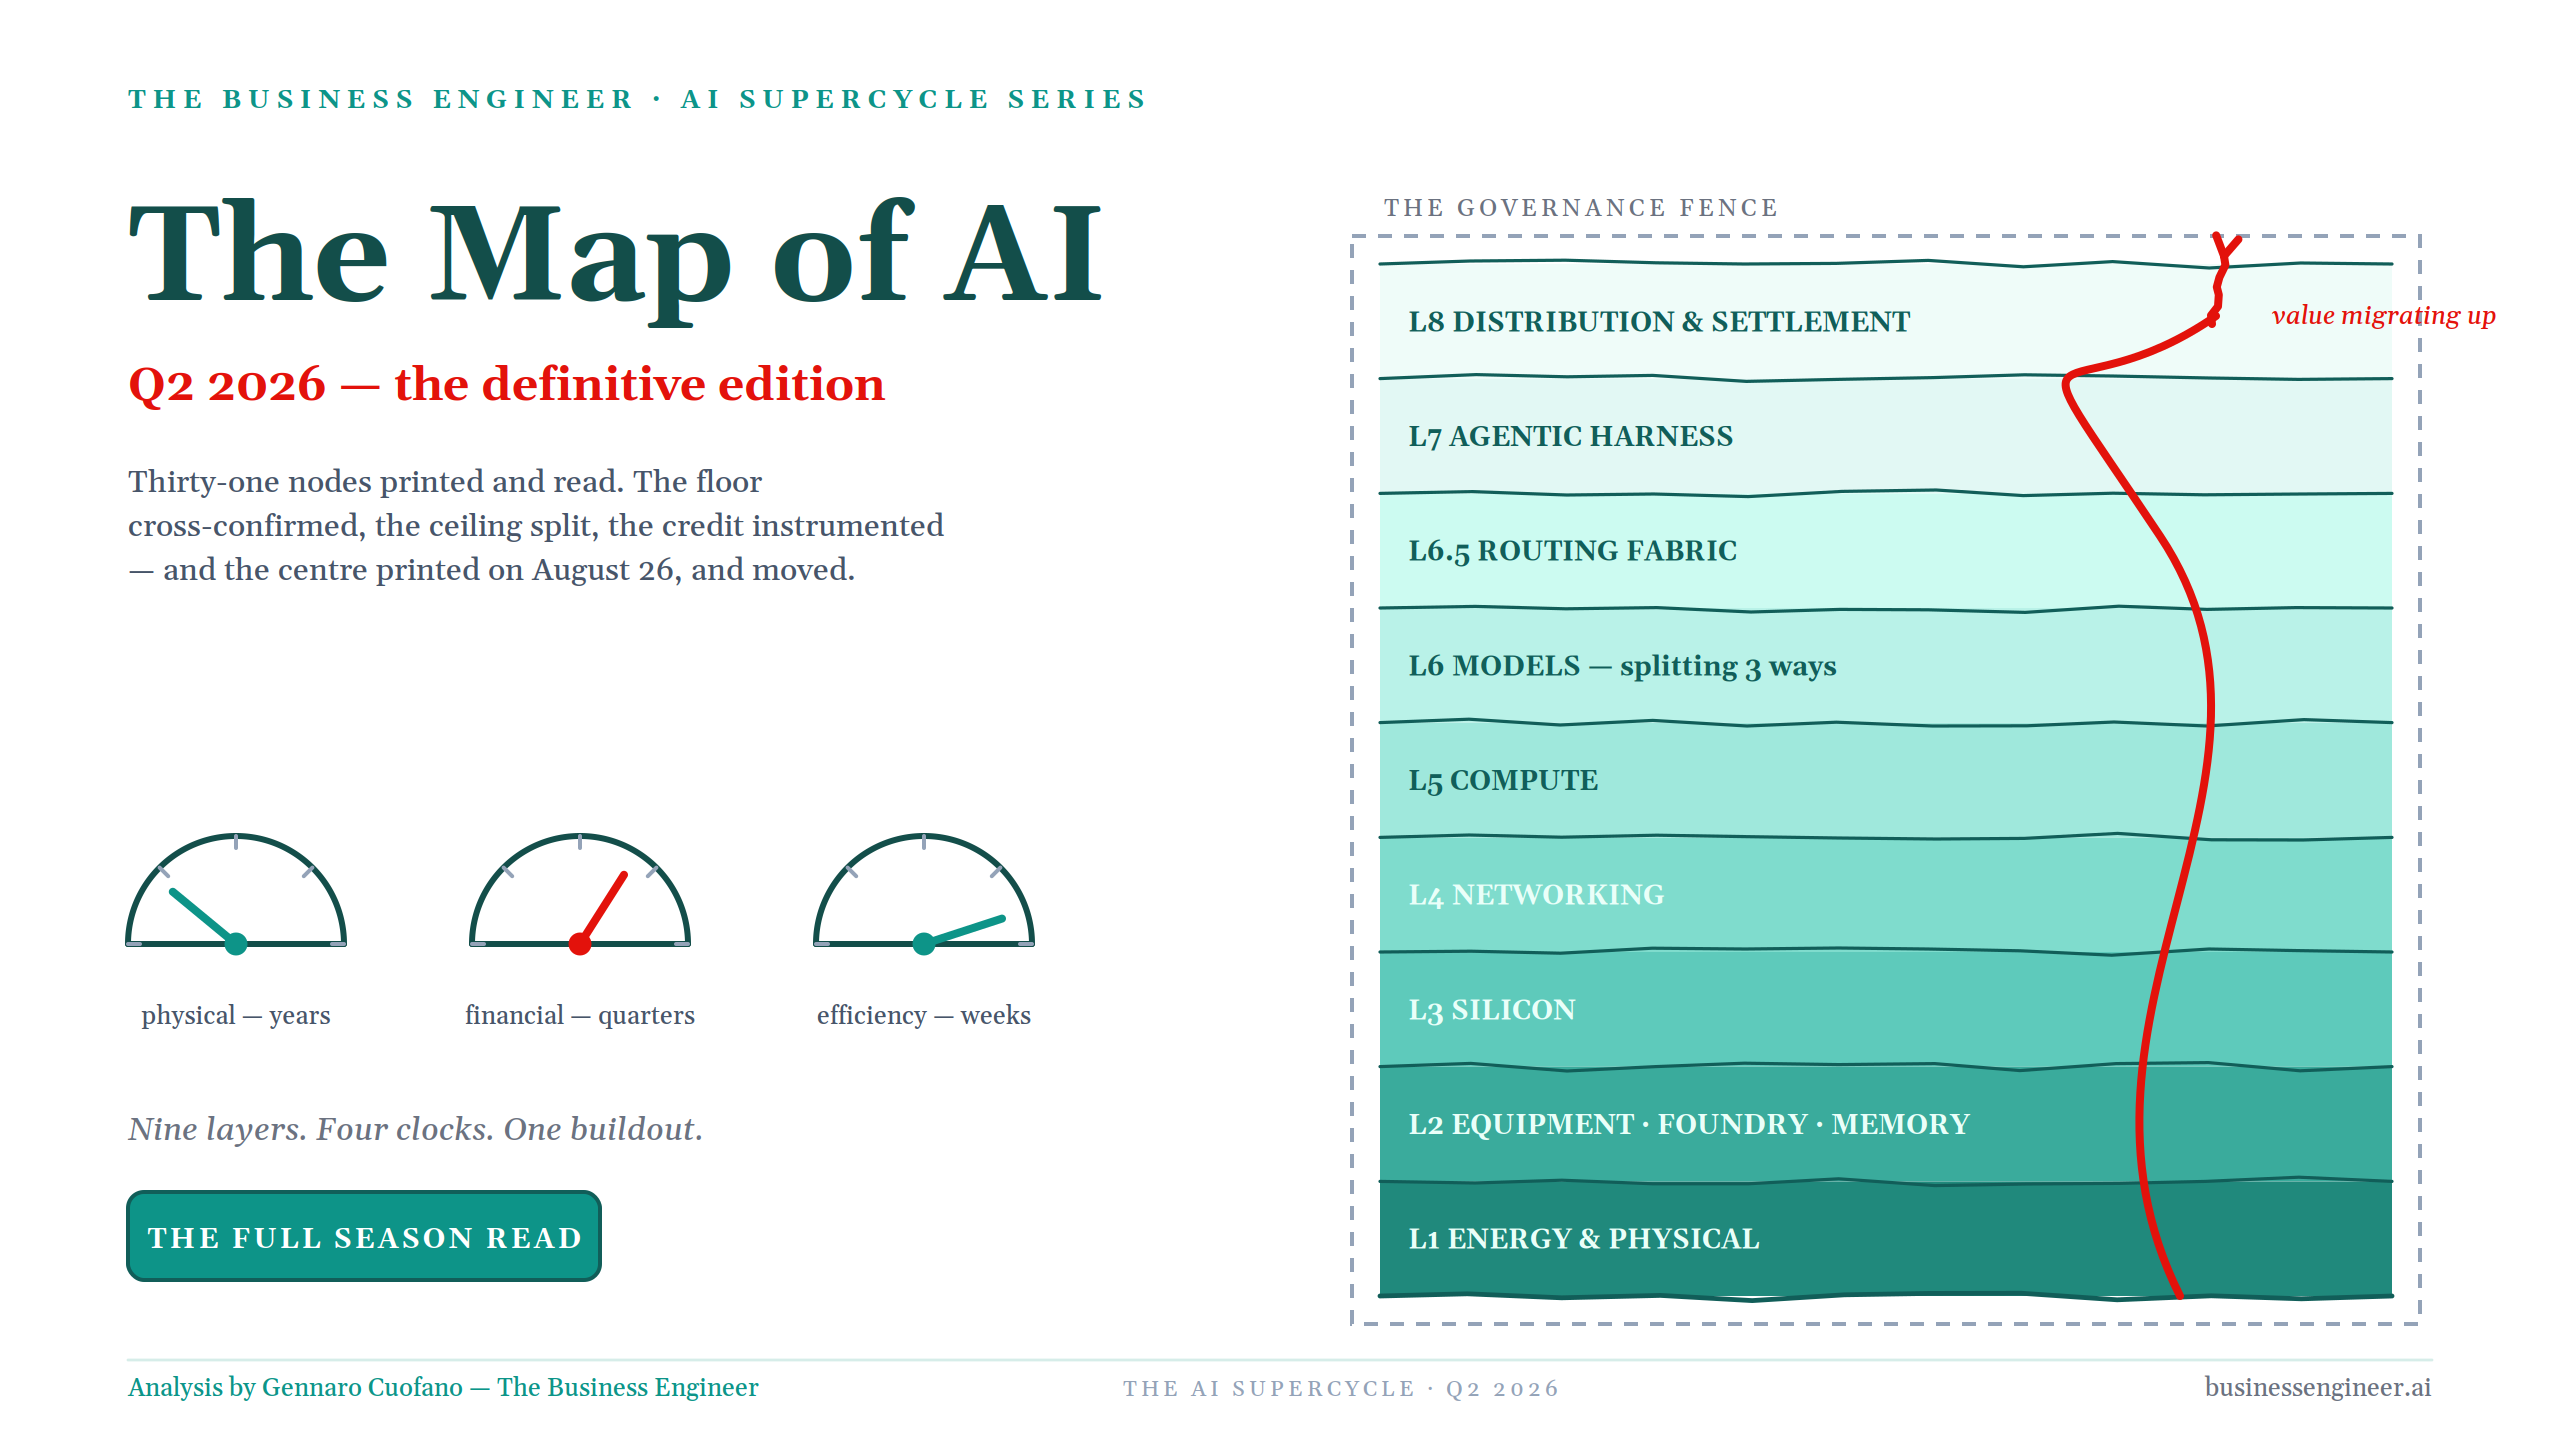
Inside that geopolitical frame sit nine economic strata: L1 energy and physical; L2 equipment, foundry and memory; L3 silicon; L4 networking; L5 compute; L6 models; L6.5 routing fabric; L7 the agentic harness; L8 distribution and settlement; with governance surrounding all of them.
Three rules follow. First, value migrates upward but concentrates at junctions, rails and seams, not necessarily in the models themselves.
Models can increasingly be rented; the routing junction can be owned. Second, the governance fence cuts across every layer. Third, the credit map is not the technological layer map. Financial contagion can jump vertically through financing structures rather than move neatly from one adjacent layer to another.
That leads to one of the most important ideas in the deck: as models commoditize, value migrates toward the routing junction and the access-and-settlement seam.
Why compute demand has this shape
To understand why the physical build remains so intense even while models become cheaper, follow an AI dollar through three stages: training, prefill and decode.
Training is amortized across enormous usage. Once spread, the cost can become pennies per token. Prefill is parallel and GPU-native, roughly five times cheaper than decode in the framework. Decode is different: sequential and heavily memory-bound. That means some of the hardest constraints sit precisely at HBM, CoWoS packaging and the leading-edge process nodes.
Then usage changes the arithmetic. A basic chat interaction may represent roughly 1x the computational load; reasoning can push the same question toward 5–20x; agentic workflows can push it toward 50–200x as software loops, calls tools, evaluates intermediate outputs and continues working without a human prompting every step.
This produces what I call the Kimi Paradox: the efficiency clock reduces the cost per token, but cheaper intelligence expands usage faster than it reduces unit price. Total spend can therefore rise while models become cheaper.
Commoditization is simultaneously the router’s tailwind and the physical floor’s order book.
That is why the sequence of bottlenecks matters. The constraint has migrated from packaging in 2023, to HBM in 2024, EUV in 2025, power in late 2025 and credit by July 2026. For the first time, the map is starting to show more than one constraint binding at once.
The core asymmetry follows: supply turns in years; demand turns in quarters. Every company building physical capacity today is effectively betting that the size and shape of today’s demand survive the years required to deliver that capacity. Shape can change quickly. Committed concrete cannot.
That is where the risk lives.
Thirty-one probes, one structure
The map is built by reading individual company prints as probes into the system rather than asking each company to answer the entire AI question. Thirty-one nodes were read during the season, each compressed into a single falsifiable verb.
The resulting scorecard is revealing: Nvidia Banked; Microsoft Absorbed; Alphabet Stretched; Meta Overshot; Amazon Paid; Apple Skipped; Salesforce Conceded; CoreWeave Refinanced; Nebius Pre-funded; Cerebras Bought; Palantir Escaped; Qualcomm Reached; Supermicro Carried; Lumentum and Vertiv Armed; Equinix Commenced; SoftBank Funded.
The verb matters because it forces a local verdict. Alphabet stretching does not mean the supercycle stretched. CoreWeave refinancing does not mean the credit system is safe. Salesforce conceding the interface does not mean enterprise software disappears.
The node answers the question assigned to that node. The map decides what question to ask.
The floor is real, and it has two kinds of rent
The strongest confirmation comes from the bottom.
ASML mints the machines. TSMC allocates the wafers. Nvidia, at the road’s end, increasingly finances the traffic it supplies. The first two are independent monopolistic institutions looking at the same physical demand curve.
ASML raised its FY26 outlook toward roughly €43–45 billion, with EUV demand reaccelerating and memory equipment surging. TSMC reported HPC/AI at roughly 61% of revenue, with CoWoS still a binding constraint and capex being raised into the same window.
Two independent monopolies pointing toward the same demand curve make the “demand is fake” argument extremely difficult to sustain at the physical floor.
But not every margin at the floor has the same durability. ASML and TSMC collect monopoly rent because very few institutions can perform their functions. Lumentum and Vertiv collect tightness rent because optics and power are temporarily scarce relative to the build. Both can generate exceptional economics; only the first category is protected when capacity catches up.
Memory shows how quickly scarcity can mutate into finance. A wafer increasingly creates far more economic value when directed toward HBM than toward commodity memory. Prices rose roughly 30–85% on comparatively modest bit growth, turning SK hynix, Samsung and Micron into toll booths on the build.
Then the memory producers signed sixteen take-or-pay contracts with price floors extending toward 2030, representing roughly $100 billion of minimum revenue.
At that point the risk changed form. The producer no longer asks, “Will someone buy this output?” It asks, “Will the counterparty behind the contract still be able to pay?”
Market risk became counterparty risk.
The bill also escaped the AI site. Qualcomm, a company that does not sit at the centre of AI infrastructure construction, saw more than $1.50 of EPS removed through the same memory squeeze.
That was the first clean proof that the inflation generated by the build was beginning to reach companies standing beside it.
The builders: one build, eight radically different financial positions
Put the major builders on one instrument, capex as a percentage of revenue, and the financial strategies diverge dramatically.
Apple sits at roughly 2%. It has essentially opted out of the physical arms race, renting intelligence through a meter for roughly $1 billion a year and expensing it instead of building the infrastructure itself. Free cash flow remains around $110 billion. The striking point is not that Apple is “behind”; it is that opting out cleanly is itself a strategy, and the market has valued that strategy at around $5 trillion.
Tesla sits around 20.5%. But unlike Apple, it is neither cleanly outside the build nor economically strong enough to absorb it easily. The deck’s counterfactual is intentionally uncomfortable: roughly 68% of net income came from the mark on its sibling, while Tesla was funding 20.5% capex intensity from around a 1.4% margin. SpaceX, meanwhile, had already out-earned it. Apple skipped the build; Tesla became trapped beside it.
Amazon sits near 27%, with AWS generating perhaps the strongest operating page of the season while the cash page flipped negative. AWS margins approached 40%, yet Amazon produced its first negative free cash flow in years. Both conditions can be true simultaneously: tremendous operating strength and tremendous cash absorption.
Microsoft sits near 35% and remains the cleanest self-funded builder. Buybacks increased rather than stopped and no new debt was required, but the strain migrated beneath the waterline. Microsoft alone carried around $196.6 billion of signed-but-not-yet-commenced leases, while the broader builder set now carries an enormous stock of future lease obligations. The financial stress did not vanish; it changed accounting location.
Alphabet sits near 46%, deliberately stretching. Cloud grew around 82%, margins moved from roughly 20.7% to 35.6%, backlog reached around $514 billion, and free cash flow turned negative at roughly -$5.9 billion. This is not a weak company borrowing to survive. It is a fortress choosing to transform itself into an infrastructure company.
But Alphabet also reveals a deeper architectural problem: the inference cage it built from TPUs. The company is increasingly selling TPU capacity externally, including multi-gigawatt commitments to Anthropic, while its own frontier researchers compete for access and Google reportedly rents around $920 million per month of Nvidia capacity to bridge-train its frontier. The v8 split between separate training and inference chips is the admission, read backward: the same quarter the market celebrated TPUs becoming a merchant product, the internal organization felt the constraints created by commercializing them.
Meta sits around 54%. This is the point where self-funding visibly cracked. Capex approached operating cash flow, buybacks shut, and debt increased by around $24.9 billion in one quarter. The important distinction is that Meta did not overshoot demand. It overshot its ability to self-fund the capacity required to serve it.
Oracle sits around 86%. Every major financing channel is being pulled at once. It is the cleanest large-company example of the financial clock accelerating faster than the operating clock.
Then there is SpaceX at roughly 235%, a number the instrument cannot hold: around $18.4 billion of capex on $7.8 billion of revenue, with approximately 86% of that capex tied to AI. The overflow is not a charting error. It is the datapoint.
And SpaceX shows where vertical integration may be going. Launch economics finance Colossus; Colossus trains Grok; Grok powers an agent inside distribution; usage generates training signals that return to the model. Most builders rent parts of this flywheel. SpaceX increasingly owns every station on the rim.
Follow one dollar of capex
The physical conversion chain exposes another pattern. Follow one dollar of AI capex through the companies that turn it into operating compute.
Lumentum and Vertiv collect the rent through optics and power, with margins expanding and comparatively clean balance sheets. Supermicro carries the float, including an extraordinary working-capital swing while operating at only roughly 11–17% gross margins. CoreWeave carries the leverage, with interest expense approaching a quarter of revenue. Equinix keeps the collateral, as the landlord beneath the entire structure, with cabinets being pulled forward from 2027 and one of the largest guidance raises in its history.
The economic rule is strikingly consistent: the closer you are to a genuine physical constraint, the fatter the margin and cleaner the balance sheet; the closer to assembly, the heavier the working-capital burden; the closer to deployment, the greater the leverage; and the landlord keeps the deed.
CoreWeave and Nebius then produced an almost perfect natural experiment. Same basic market, opposite balance-sheet sign.
CoreWeave finances a $129 billion backlog that is fundamentally a promise to be paid later, using debt and increasingly public unsecured paper. Nebius has already collected billions of customer prepayments. Its customer is effectively financing part of the infrastructure before delivery.
The customer, it turns out, can be the lender.
And CoreWeave provided the first live test of the financing joints beneath the cycle. Private GPU-backed credit did not crack. It refinanced into a syndicated term loan, unsecured bonds and a Eurobond.
The joint survived. The risk did not disappear.
It changed owners.
Then the centre printed, and moved
Until August 26, Nvidia could still be described mainly as the purest beneficiary of the AI buildout. The builders spent; Nvidia got paid.
The latest balance sheet broke that description.
The operating engine remains extraordinary: roughly $96.2 billion of revenue, +106%, and $63.7 billion of operating income. But the operating engine is no longer the most interesting part of the story.
Nvidia is now financing the ecosystem that buys its products through four channels.
Customer credit: receivables increased by roughly $22.3 billion in one quarter, while DSO moved from about 45 to 60 days.
Equity in the buyers: the investment book expanded to roughly $93.9 billion, with huge amounts of capital being deployed into companies whose value in turn depends on buying Nvidia hardware.
Power guarantees: structures such as the Pike data-center wrap bring Nvidia directly into the financing of the physical capacity its chips require.
Bond-funded returns: roughly $24.9 billion was raised while shareholder returns exceeded operating cash flow, placing Nvidia firmly onto the financial clock.
The geometry is extraordinary. For every $1 of its own plant, roughly $6 went into buyer equity and $8 into receivables.
The supplier is financing the customer. It owns pieces of the customer. It helps guarantee the infrastructure used by the customer. Then it sells the customer the equipment.
Nvidia has become the House of Morgan of the AI buildout: supplier and banker on the same balance sheet. Morgan did not sell the locomotives. Nvidia does.
There is another consequence. Roughly one dollar in six of first-half earnings is now a mark on companies whose value depends on buying the chips. Earnings quality and credit quality have begun to converge.
And the financing wrapper is moving outward. A syndicate representing more than $500 billion across Apollo, BlackRock, Blackstone, Brookfield, Goldman Sachs, KKR and others increasingly sits around the infrastructure build. Whether this represents a genuine transfer of risk away from Nvidia or a recourse round-trip that eventually returns depends on terms that remain unpublished.
The beat raises the hurdle
Nvidia’s data-center revenue now annualizes above roughly $356 billion. That is spectacular operating performance. It is also a higher hurdle.
Every incremental chip shipment is capital that someone farther up the stack must earn a return on. Run the incremental shipments through the return framework and they require roughly $64 billion a year of additional end-customer revenue. The application layer is currently adding something closer to $45 billion.
A record Nvidia quarter therefore produces two signals at once: demand for infrastructure is unquestionably real, but the required monetization hurdle is rising faster than the application layer is clearing it.
Sovereign demand provides one offset. Governments can buy strategic compute without requiring the same commercial return as a private company. Again: the state sets a floor; it does not clear the hurdle.
The broader reconciliation makes this even clearer. The deck counts roughly $185 billion of AI revenue at the season’s close against a return hurdle of roughly $602 billion on deployed capital.
That means about 31% of the tank has been cleared.
There are important positive signals inside that gap. The leading lab has already printed positive adjusted operating income. AI revenue is no longer hypothetical. But debt’s share of capex has moved from roughly 9% to 32% in eight quarters, turning what began as allocation into obligation. And to stay ahead of the coming depreciation wave, the revenue line needs to compound at something like 43% annually for another three years.
This is not a claim that the investment cannot work.
It is a measurement of how fast the return side now has to run.
The ceiling finally got a number
At the top of the stack, monetization is real too.
The action layer has crossed roughly $1 billion of AI annual contract value, and the number matters because it appears at the junction rather than at one particular model. The ecosystem around it already includes Copilot at roughly 30 million seats, Gemini Enterprise across about 90% of the Fortune 100, Palantir AIP, ServiceNow’s Otto, AWS Bedrock and Salesforce Agentforce. Anthropic was named the first design partner at the action layer, another signal that trust is concentrating at the junction.
Deployments at that junction have risen roughly 9x in nine months.
Underneath it, Claude, GPT, Gemini, Kimi and the broader open cohort increasingly look like a rented, interchangeable model field. The models remain critical, but commoditization strengthens the economics of the layer that selects, routes, governs and meters them.
The ceiling still pays to run: gross margin is absorbing roughly 300 basis points in the framework. But that is precisely the thesis: models get rented; the junction gets owned.
Salesforce shows what happens to the incumbent interface. Organic growth is only around 6%, operating income is essentially flat, and the headline EPS growth is heavily distorted by investment marks and financial engineering. Meanwhile its own operating data show machine calls rising roughly sixfold while human usage remains flat, with integration-related revenue already moving negative.
The system is still being used. Increasingly, the user is software.
So Salesforce conceded. It stopped insisting that the human application screen remain the front door and began positioning itself as the governed record underneath the agent.
That is strategically sensible.
It is also a downgrade in where the economic junction sits.
One plant, six bills
This provides the cleanest framework for asking who ultimately pays for the AI build. The bill leaves the plant through six doors.
Capex is paid by the builders today and arrives later as depreciation. Components spread the cost outward through things such as the memory tax hitting Qualcomm and AMD’s consumer lines. Discovery hits businesses such as Reddit when the model consumes the funnel while the P&L still appears strong. Gross margin absorbs the cost at infrastructure intermediaries such as Cloudflare as they carry the machine web before monetizing all of it. The application P&L takes inference into COGS across companies such as Figma, ServiceNow and Salesforce.
Then comes substitution, which is different in kind.
The first five are costs rising. The sixth is a revenue line going negative because the agent routes around the product itself. Salesforce provides the early shape: machine calls up, human interaction flat, integration revenue down.
By the time substitution is obvious in consolidated revenue, the interface may already have moved.
Follow the same current farther along the value river and four different fates appear. Reddit pays because content can be summarized upstream. Shopify collects because a transaction still has to clear somewhere. Palantir compounds because it sits at an enterprise junction through which context, decisions and actions route. Figma pays now while betting it becomes the creation substrate later. Cloudflare builds the access seam, the toll system for discovery, identity, measurement and eventually payment when the visitor is software rather than a person.
The question is not merely whether AI creates value.
It is where you are standing when the value flows past you.
The model layer is splitting three ways
The model layer is no longer one market.
The first regime is the closed frontier, led by OpenAI, Anthropic and Google, currently representing around 58% of countable AI revenue in the framework.
The second is the expanding open-weight flank. Chinese open models placed enormous pricing pressure on the frontier; the Western response is increasingly an open-weight cohort of its own, competing from below at the routing junction. The strategic response to Chinese open models may therefore be a competitive Western alternative, not export restrictions alone.
Then comes the third path, potentially the most important for the enterprise over the next one to two years: open weights plus the harness as a co-design surface, allowing enterprises to build internal models around their own data, workflows and operating core.
That changes the enterprise question from Which model should we buy? to Which intelligence should we own at the core?
The harness becomes the mechanism through which that intelligence is adapted to the enterprise rather than merely rented from the frontier.
Competition is changing with it. Increasingly, the alliance rather than the individual firm becomes the unit of competition.
The deck already shows vendor-to-vendor stacks forming around Nvidia and Intel, Palantir and SAP, Anthropic and Amazon, ServiceNow and Microsoft. Each alliance tends to open the layer below while trying to hold its own economic junction.
Signature lists therefore become architectural maps. Who needs which layer open? Which layer must commoditize for the alliance to work? Which junction does each participant intend to own? Who is absent?
Absence is also a strategic position, until it ends.
AMD provided the example this quarter by entering at scale through the Anthropic 2GW Helios relationship and Microsoft’s Helios-on-Azure path. Alliance formation and defection lead; revenue follows.
Where it would actually break
The map now has three identifiable financing joints connecting the slow physical floor to the faster credit clock at the ceiling.
Joint 1 has already been tested. The chain runs from lab to neocloud to private credit. CoreWeave hit the test in August and refinanced rather than cracked, pushing the risk outward into public unsecured markets and Europe.
Joint 2 is forming around power and compute. Increasingly, power assets and compute are stapled together through SPVs with cross-default structures. The megawatt gate is therefore acquiring a financial failure mode: a problem in the financing vehicle can interfere with access to the physical resource.
Joint 3 remains quiet. The floor is protected by memory take-or-pay contracts while the ceiling remains dependent on credit. If these curves separate, the first visible signal may arrive through 2027 memory-order revisions, where long-duration floor commitments collide with weaker ceiling economics.
Then comes the jack under the footing.
The deck identifies OpenAI equity as a potential first-loss layer underneath a roughly $10 billion SoftBank Vision Fund 2 margin loan. If the equity mark falls far enough, mandatory prepayment can be triggered even while the same mark is being carried as live collateral.
That is the uncomfortable circularity: the equity is debt-funded; the collateral is a set of marks; and the marks are on the very assets being bought.
Contagion therefore does not need to move horizontally through adjacent technology layers. It can run vertically through financing joints, breaking bottom-up: the weakest tenant first, the structure above it second.
AI is now a macro variable
The buildout has become large enough that it can influence the macro environment in which it must finance itself.
The Federal Reserve has already pulled AI capex into the same macro conversation as war and tariffs, asking whether visible chip inflation is the entire street or simply the part illuminated by the streetlight.
The feedback loop is straightforward: if the AI build drives inflation, financing the AI build becomes more expensive because of the AI build.
Memory provides the first concrete transmission mechanism. Scarcity raises component prices. Those prices move into products outside AI. Inflation stays firmer. Rates remain higher. Financing costs rise. More capital-intensive AI nodes then face a higher hurdle.
This is where 1973 becomes useful again. Not as the master analogy for AI, but as a model of how a resource shock can attack operating economics and capital formation simultaneously.
The railway analogy gives us the architecture.
1973 gives us one possible failure mechanism.
1999 reminds us that even transformative technology can be catastrophically mispriced.
They are three different questions.
What the methodology is actually doing
This distinction between node, clock and cycle is not rhetorical. It is the methodology.
Every company is first placed on the nine-layer grid plus the seam. Each print is then graded against the four clocks: physical, financial, efficiency and adoption. The result must compress to one falsifiable verb per node. Investment marks are stripped away where possible; the operating line is read separately; each end-customer dollar is counted once at the tier where it transacts; free cash flow is preferred over operating cash flow when measuring absorption. Finally, leading indicators such as alliances, talent flows, traffic mix and disclosure changes are read alongside lagging revenue.
The assumptions are deliberately exposed. The supercycle itself and the layer grid are lenses, not findings. A correlated cross-layer drawdown would falsify the structural premise. Numerical assumptions behind the $602 billion hurdle are stated rather than hidden. Backlog conversion, persistence of demand shape through build time and eventual commoditization are forward bets. Private-company revenue figures are dated, and OpenAI and Anthropic figures are not treated as perfectly comparable because of gross-versus-net reporting differences.
The purpose is simple: make the framework capable of being wrong in public, specifically, rather than right vaguely.
That also explains the coverage. Thirty-one in-quarter nodes were read. Astera printed but was not rung. The energy layer was read primarily through Vertiv. Nvidia, the centre, printed on August 26. Oracle, Broadcom and Micron are handed into the next quarter.
What is resolved, and what comes next
Four tests from Q2 are now stamped.
Nvidia: Banked. The centre became financier as well as supplier.
CoreWeave: Refinanced. The first major financing joint was tested and survived.
Salesforce: Conceded. The largest application incumbent accepted that the agent may own the interface.
Arista: Not eaten. The networking layer survived the rack-level consolidation many expected to absorb it.
Two theses now carry into the next twelve months.
The first is open weights entering the enterprise. If the open-weight flank converts into actual internal deployments, the third path becomes real: enterprises use the harness as a co-design surface and begin owning models around their own operating core.
The second is the Meta harness. Meta combines open-model lineage, Meta Compute and one of the largest consumer distribution systems on earth. If it ships an effective harness, the agent race acquires perhaps its largest open-substrate participant.
Then six new dials come into view: power through Constellation/Vistra; grid through Quanta; money through Circle/x402; services through Accenture; the China mirror through Alibaba/CXMT; and the data substrate through Snowflake.
The immediate handoffs are equally important: Oracle’s next print tests its off-balance-sheet financing architecture; Broadcom becomes the second centre; Micron’s next quarter becomes a potential tripwire for Joint 3. Meanwhile I would keep watching DSO at the vendor bank, the terms of the $500 billion syndicate, leases that have not yet commenced, bring-your-own-model posture inside the enterprise, senior talent flows and which of the six bills is appearing in each new print.
Where this leaves the AI Supercycle
The floor is real, and it has two kinds of rent: monopoly rents at institutions such as ASML and TSMC, and tightness rents in places such as optics and power.
The financial clock has become a ladder, moving from individual builders, to companies outside the build, to cash strain within the builders, to contractual counterparty risk at the floor, and finally to the centre itself. The supplier has climbed onto the top rung.
The ceiling is monetizing, but at junctions, rails, seams and substrates, and very unevenly. Models become increasingly rentable. Routing, governance, access and settlement become increasingly ownable.
The build has six bills, and the sixth is the most dangerous because it is not a cost rising. It is revenue disappearing when the agent routes around the product.
The first financing joint has been tested and refinanced rather than cracked. The wrapper moved outward into a much larger syndicate. At the same time, every spectacular Nvidia beat raises the monetization hurdle farther up the stack.
This is why the binary bubble question is increasingly useless.
There is no single AI bubble waiting to pop. There are nodes, clocks, curves and joints.
Some nodes will overshoot. Some will refinance. Some will be substituted. Some will collect temporary scarcity rents. Some will become permanent institutions. Some infrastructure will be written down and still become essential.
That is precisely why 1846 remains the better master analogy than either 1999 or 1973.
1999 asks whether investors paid too much for the future. 1973 asks what happens when a critical input suddenly reprices. 1846 asks the question that best fits the AI Supercycle:
What happens when enormous amounts of speculative capital finance a network that is real, transformative and badly mispriced at the same time?
The answer is uncomfortable because both sides can be right. The mania can be real. The financing stress can be real. The network can be real. The panic can be real. And the network can still transform the economy after ownership changes.
That is how infrastructure supercycles work.
And it brings us back to the most important change in this quarter’s map.
The centre printed on August 26, and moved.
The house in the middle is no longer just selling the locomotives. It is financing the railway.
With massive ♥️ Gennaro Cuofano, The Business Engineer