

There is a $22.7 trillion question at the center of the AI economy.
That is the current stock market valuation resting, in one form or another, on the assumption that generative AI is a real technology wave with real revenue.
It is also, until now, the number no one has been able to properly interrogate — because the demand side of AI has been fundamentally opaque. The supply side (chips, hyperscalers, energy) is well-documented.
The demand side — what customers are actually paying for, and whether the revenue is real — has been buried inside private company reports, segment totals, and circular flows between OpenAI, Anthropic, the hyperscalers, and the app layer.
A few days ago, in our AI Supercycle session, we sat down with William Gildea from the Exponential View team to walk through their new State of the AI Economy report — the most rigorous attempt I’ve seen to solve the demand-side visibility problem.
What the Exponential View team did — building bottom-up financial models for 1,000+ firms, tracing every revenue line back to primary filings, and then deduplicating the flows so a single dollar doesn’t get counted three times as it flows down the stack — is exactly the kind of work the industry needs but almost nobody had done.
Below is a compressed strategic reading of that report — organized around the five layers they use (Demand, Economy, CapEx, Tokens, Stack), along with the mental models that matter for anyone trying to navigate this cycle over the next decade.
Follow me on The AI Supercycle as well!
Demand: Real, Big, and Faster Than Any Wave Before It
Follow me on The AI Supercycle as well!
The headline number: $110 billion in trailing 12-month deduplicated GenAI revenue, now running at a $175 billion annualized pace. That gap — 1.6x between banked and run-rate — is itself the growth signal.
Three things make this number different from prior wave estimates:
It’s deduplicated. When a Cursor customer pays $100, roughly $60 of that flows to Anthropic or OpenAI as token spend, and roughly $30 of that flows to Azure, AWS, or a NeoCloud for compute. If you naively stacked those, you’d count $190 of “AI revenue” from $100 of actual customer demand. Exponential View built full P&Ls and cash-flow statements for every major player and attributed value-add layer by layer: $40 to the app, $30 to the model lab, $30 to hosting. It sums to $100, not $190. That is what “real revenue” means in this report.
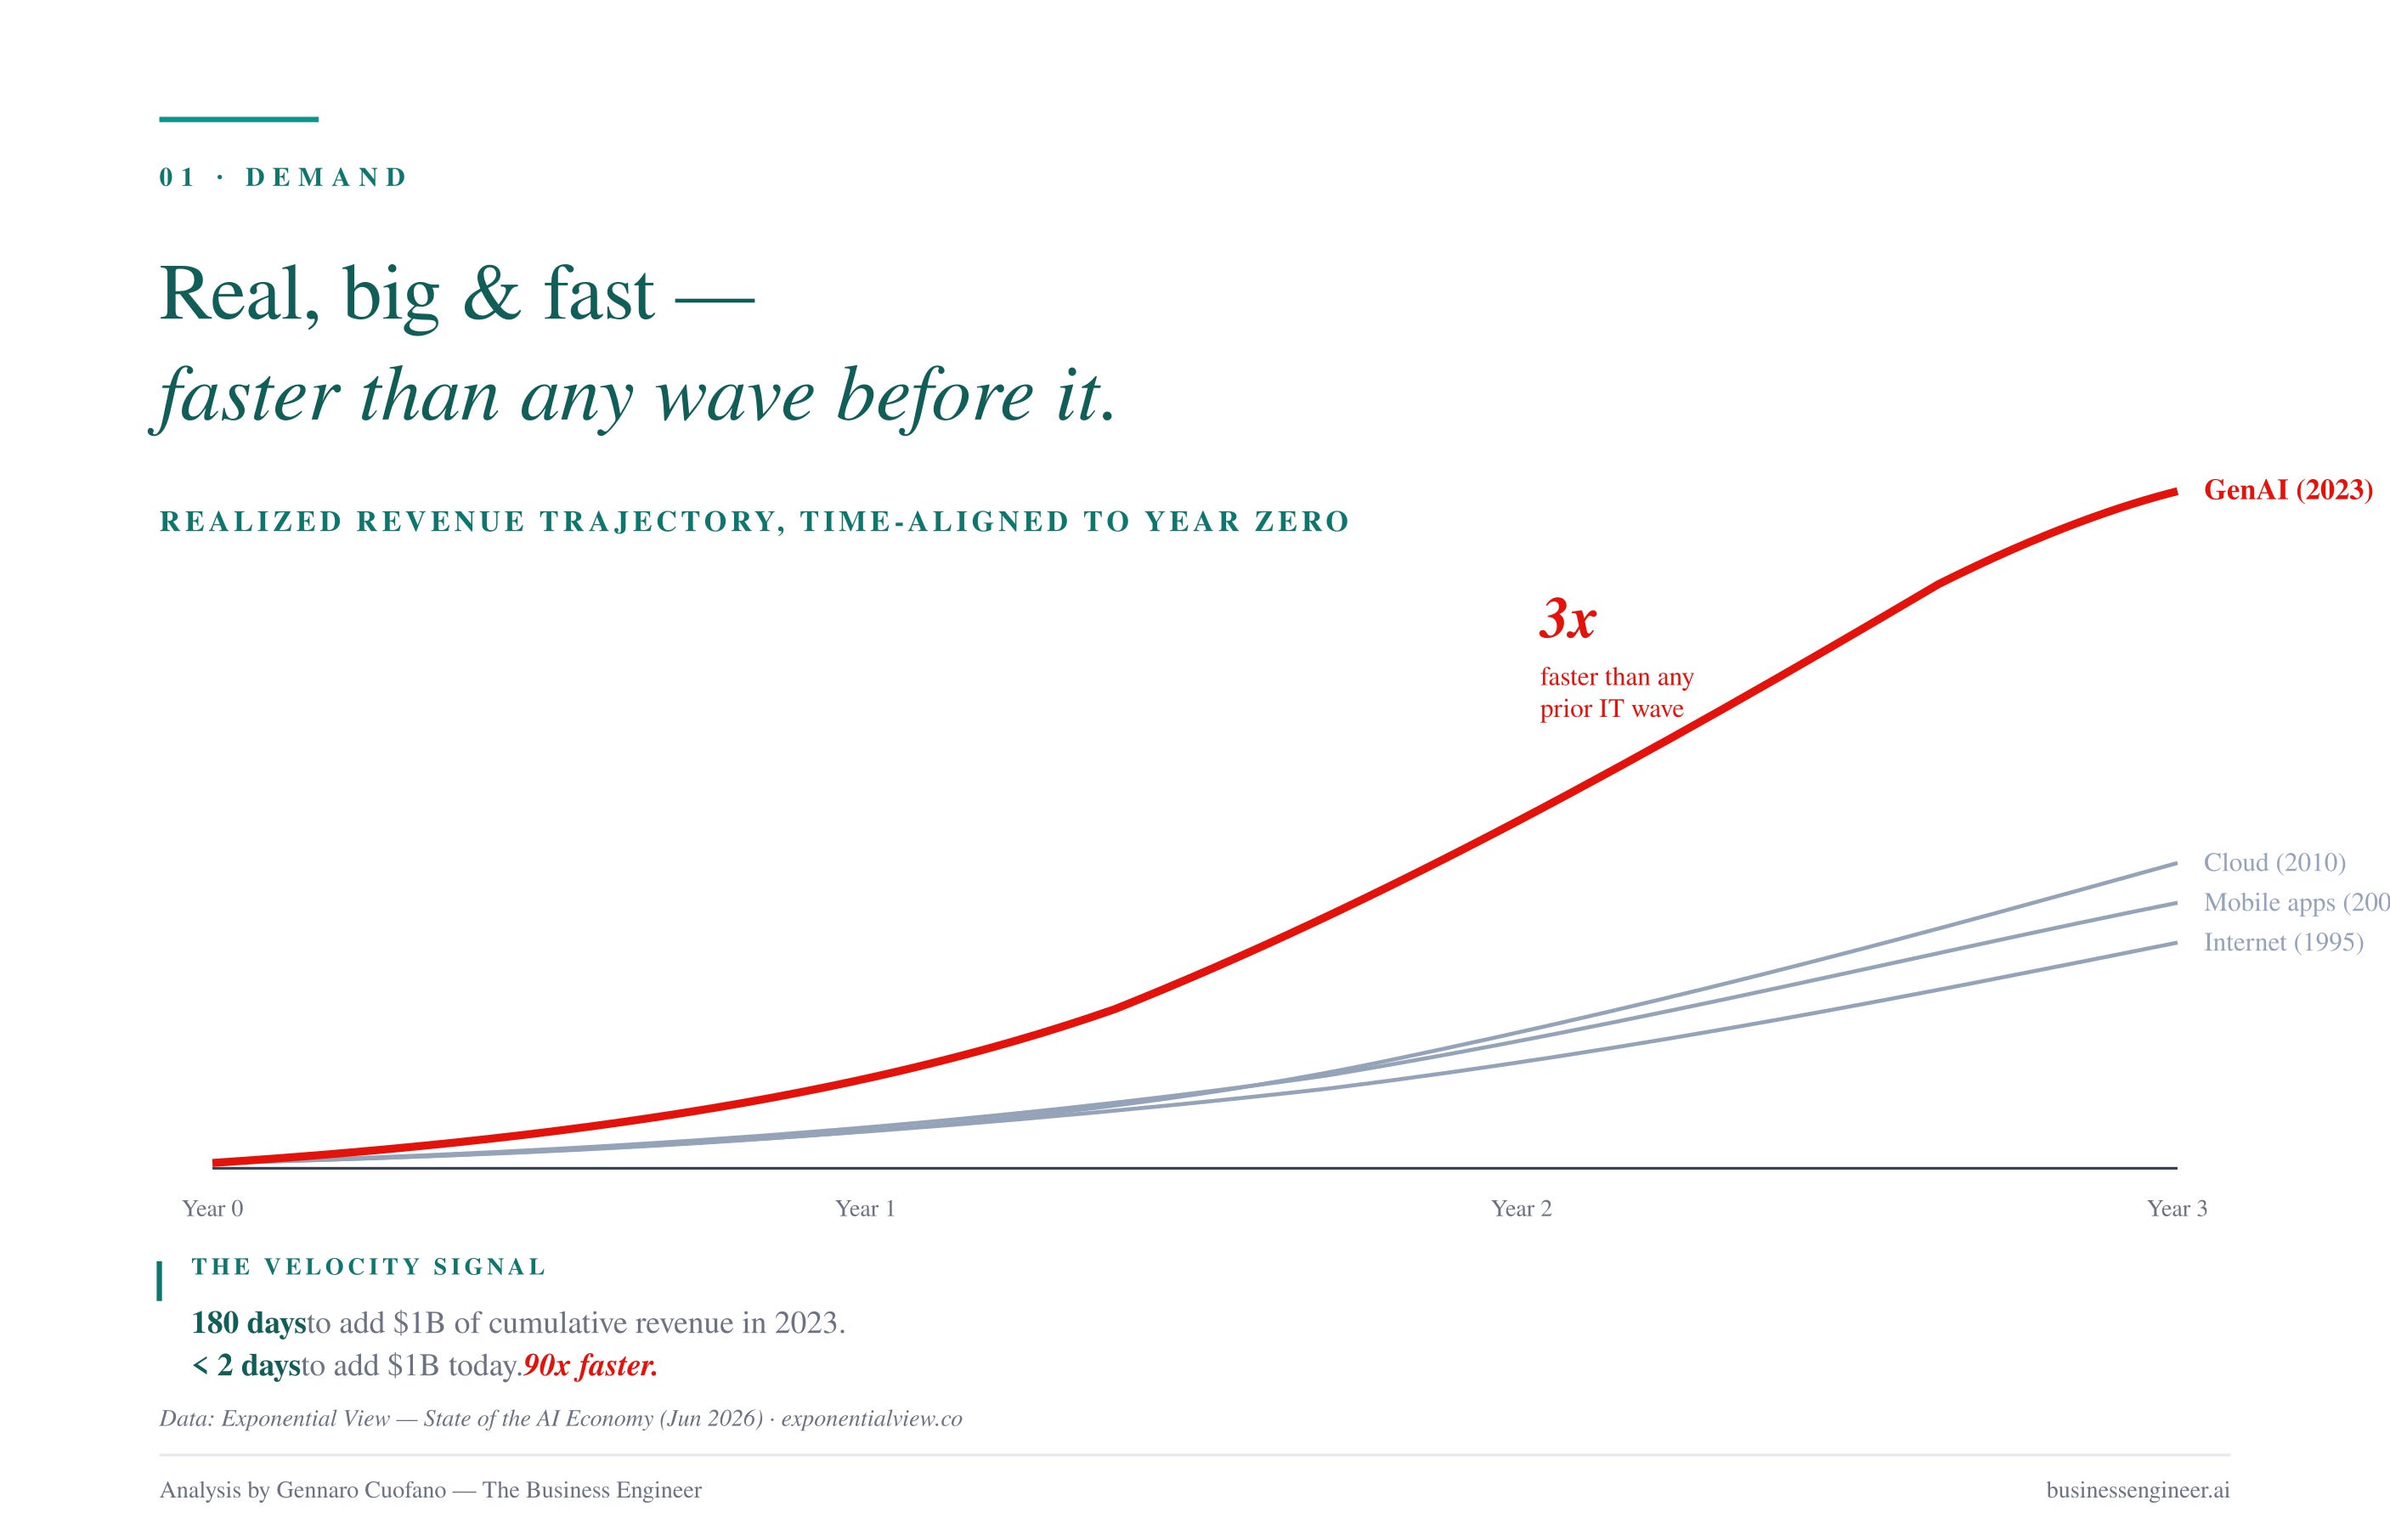
It grows 3x faster than any prior IT wave. Internet (1995), mobile apps (2007), cloud (2010), GenAI (2023) — time-aligned to year zero, GenAI is on a trajectory 3x steeper than any of them. This is not a qualitative claim. It is the measurement of the first three years of revenue for each wave, adjusted for inflation.
Each new $1B of cumulative revenue is arriving 90x faster than in 2023. In 2023, it took the AI industry ~180 days to add $1 billion in cumulative revenue. In mid-2026, it takes less than two days. That is a compounding curve that the traditional “compare it to the .com era” mental model will systematically underestimate.
The reason this wave is faster isn’t primarily that AI is a “better” foundational technology than the internet was. The internet was arguably more foundational. The reason is compounding: AI is arriving in a world that already has the internet, mobile, cloud, ubiquitous payments, mature distribution, and instant global software delivery. Every prior wave is now infrastructure for this one. What took the internet a decade to distribute takes a foundation model six months.
That has two important implications the report is explicit about:
Modeling projections against prior waves systematically understates AI. Demand projections, depreciation schedules, and CapEx payback timelines built on internet-era analogies will all be too slow.
Society and institutions have far less time to adjust. The internet took a decade to reshape work, media, and family life — and we were still caught off guard. GenAI is being given twelve to twenty-four months. The adjustment gap is going to be far more violent.
Meanwhile, the compute supercycle is on. Global semiconductor revenue reached $792B in 2025, projected to hit $1.51T in 2026 — nearly double in one year, when the industry historically grew 5–8%. The US power sector, which had flatlined at ±0 TWh/month annual growth from 2008 to 2024, is now growing at +9 TWh/month. The largest data centers have grown ~50x in four years — from ~20 MW supercomputers to xAI’s Colossus (~300 MW) to Anthropic’s Rainier (targeting ~2.3 GW across ~30 buildings).
And each new data center dollar buys different things than it did five years ago. Chips’ share of build cost went from 40% to 60%. Memory went from a 2% rounding error to ~18%. The buildout has become vastly more silicon-heavy and vastly less concrete-and-cooling.
The Compression: Every naive analogy for AI understates it. This is a computing revolution being built on top of a compounding stack of prior revolutions.
Economy: Big Is Still Small, and Still Early
Follow me on The AI Supercycle as well!
This is the section that makes the report honest.
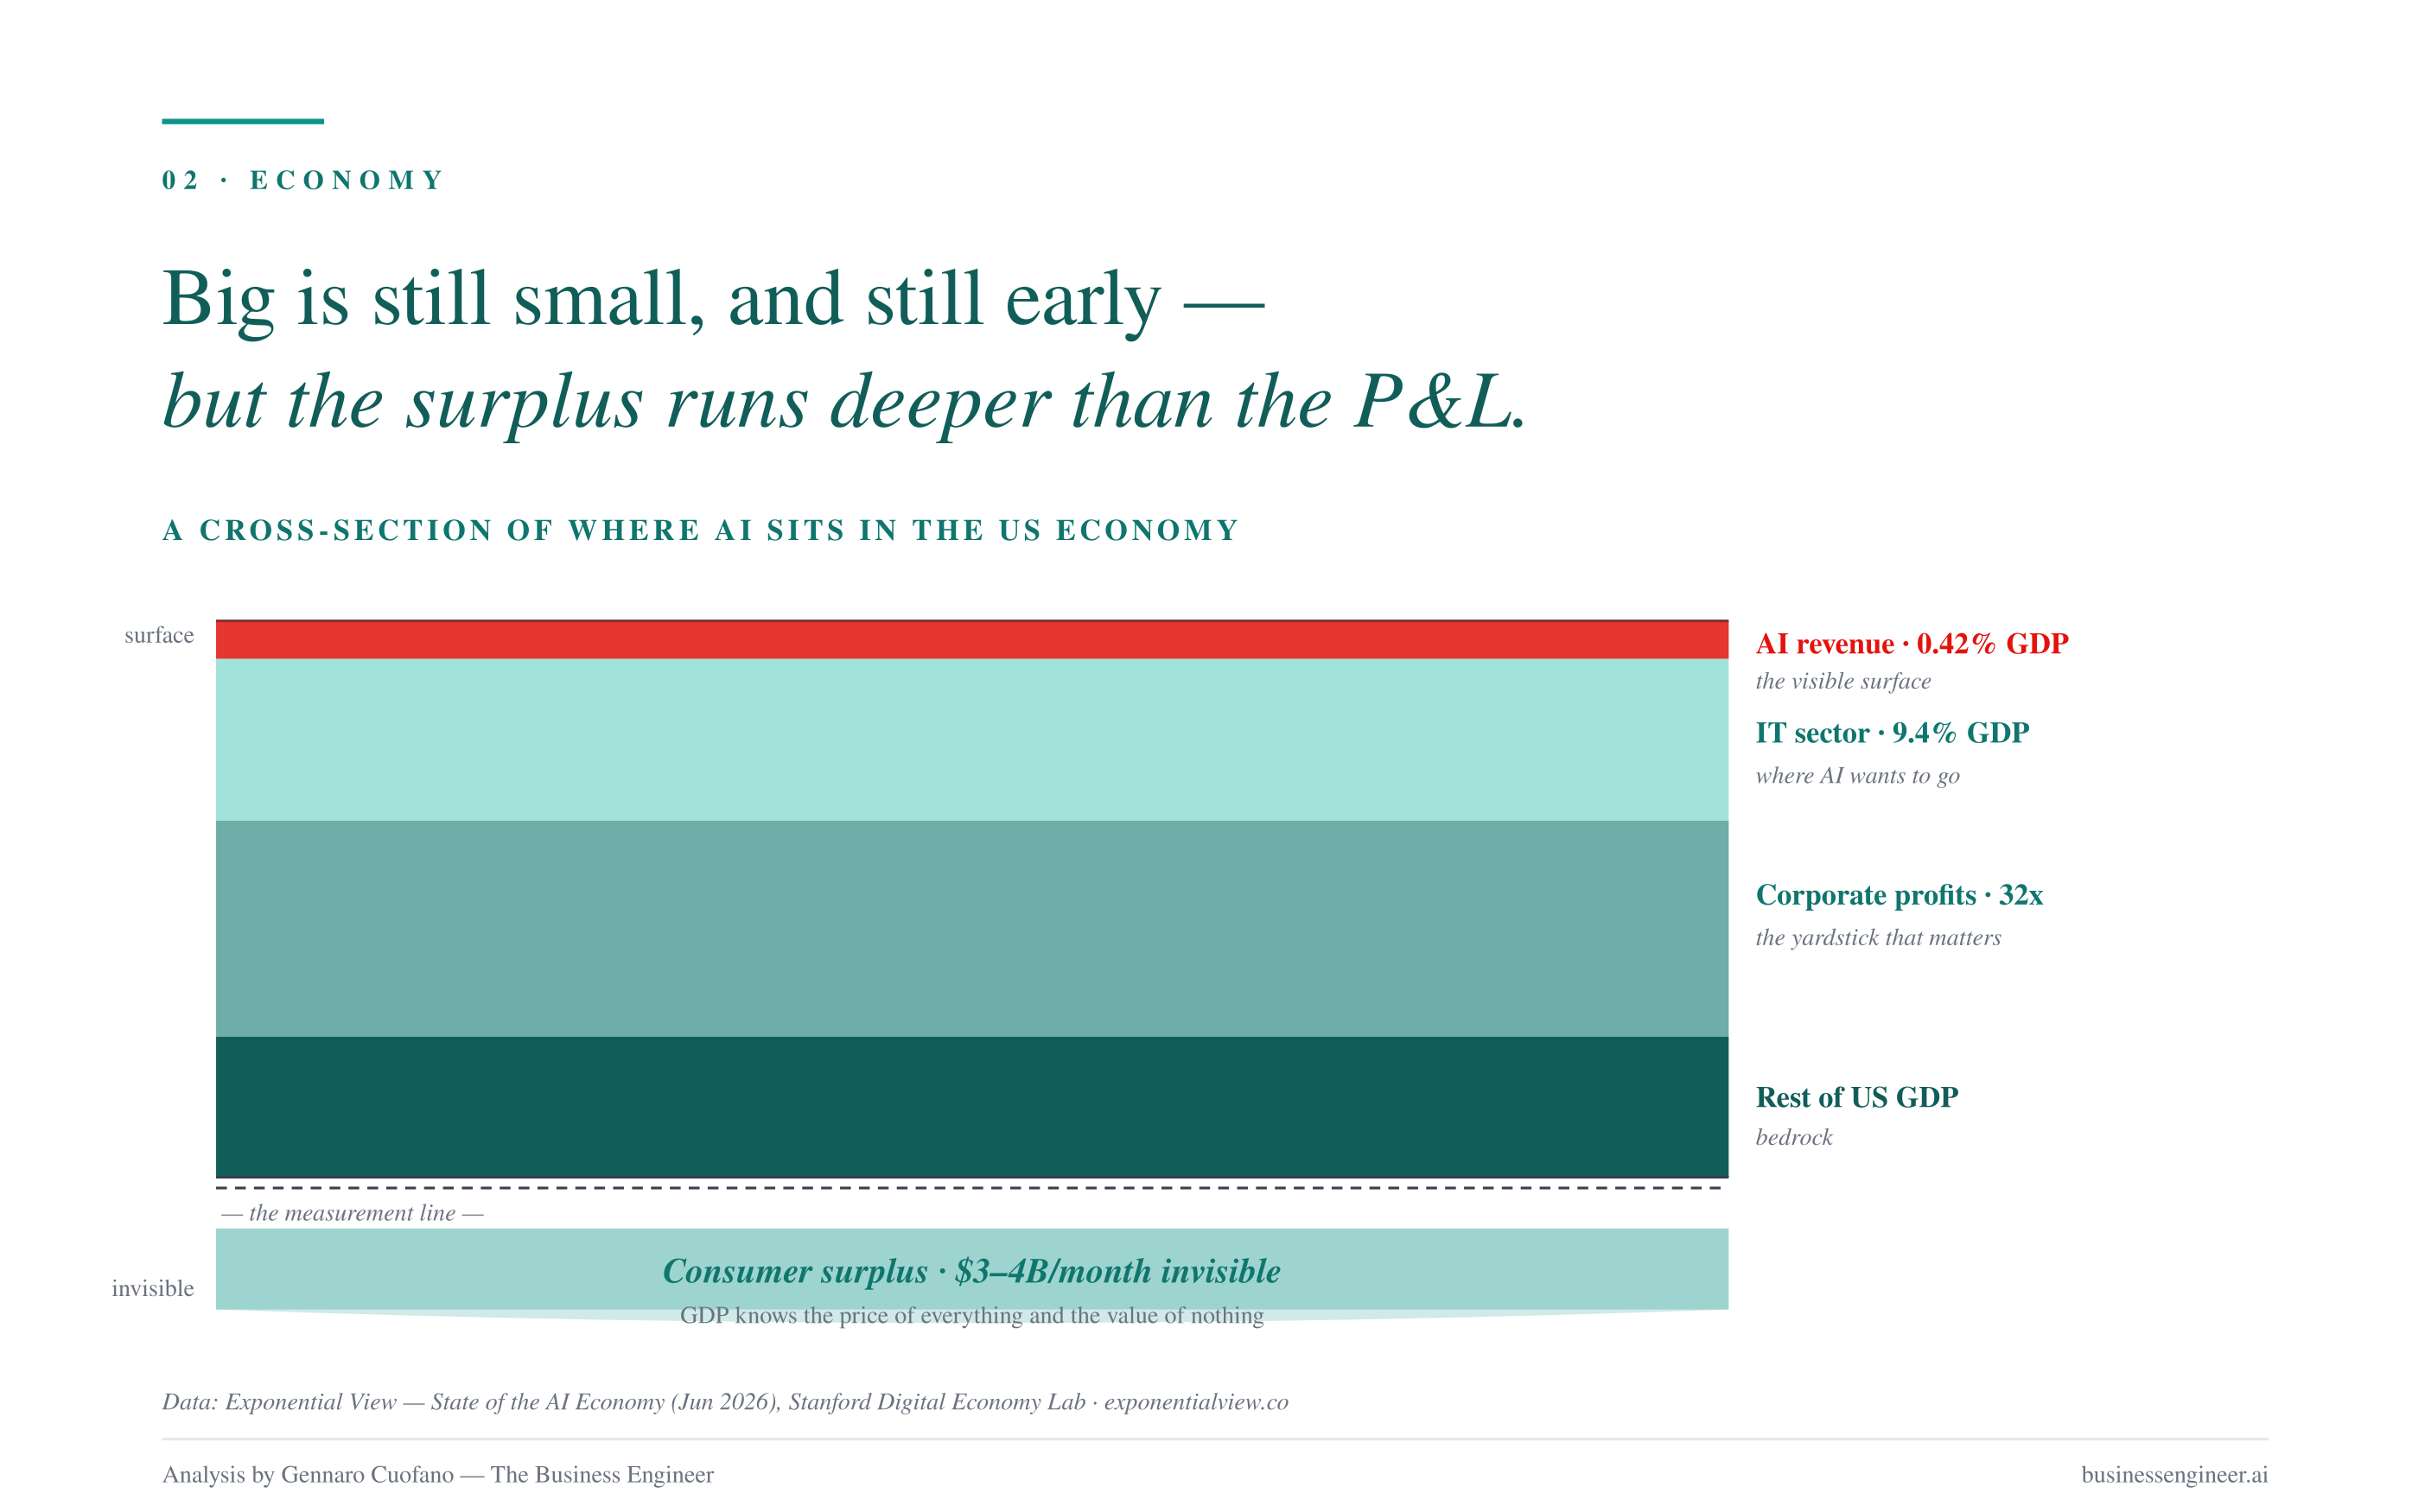
Because for all the growth above, GenAI revenue in mid-2026 is still equivalent to just 0.42% of US GDP — versus the IT sector’s 9.4%. Corporate profits alone are 32x larger than all deduplicated GenAI revenue combined.
At the individual company level, the picture is even more disciplined. Uber’s public commitment to spend up to $1.5k per engineer per month on AI puts them in the top 10% of per-employee AI spend among 70,000 US businesses tracked by Ramp. And even at that cap, the total ($~90M/year for 5k engineers) is a rounding error against Uber’s $8.7B EBITDA and $14B in people OpEx.
That is the shape of the AI economy right now: it is growing at unprecedented speed from a tiny base. Both facts are true. Both matter.
There are two more subtle observations worth pulling out of this section:
Seven in ten corporate AI claims are still about cost, not revenue
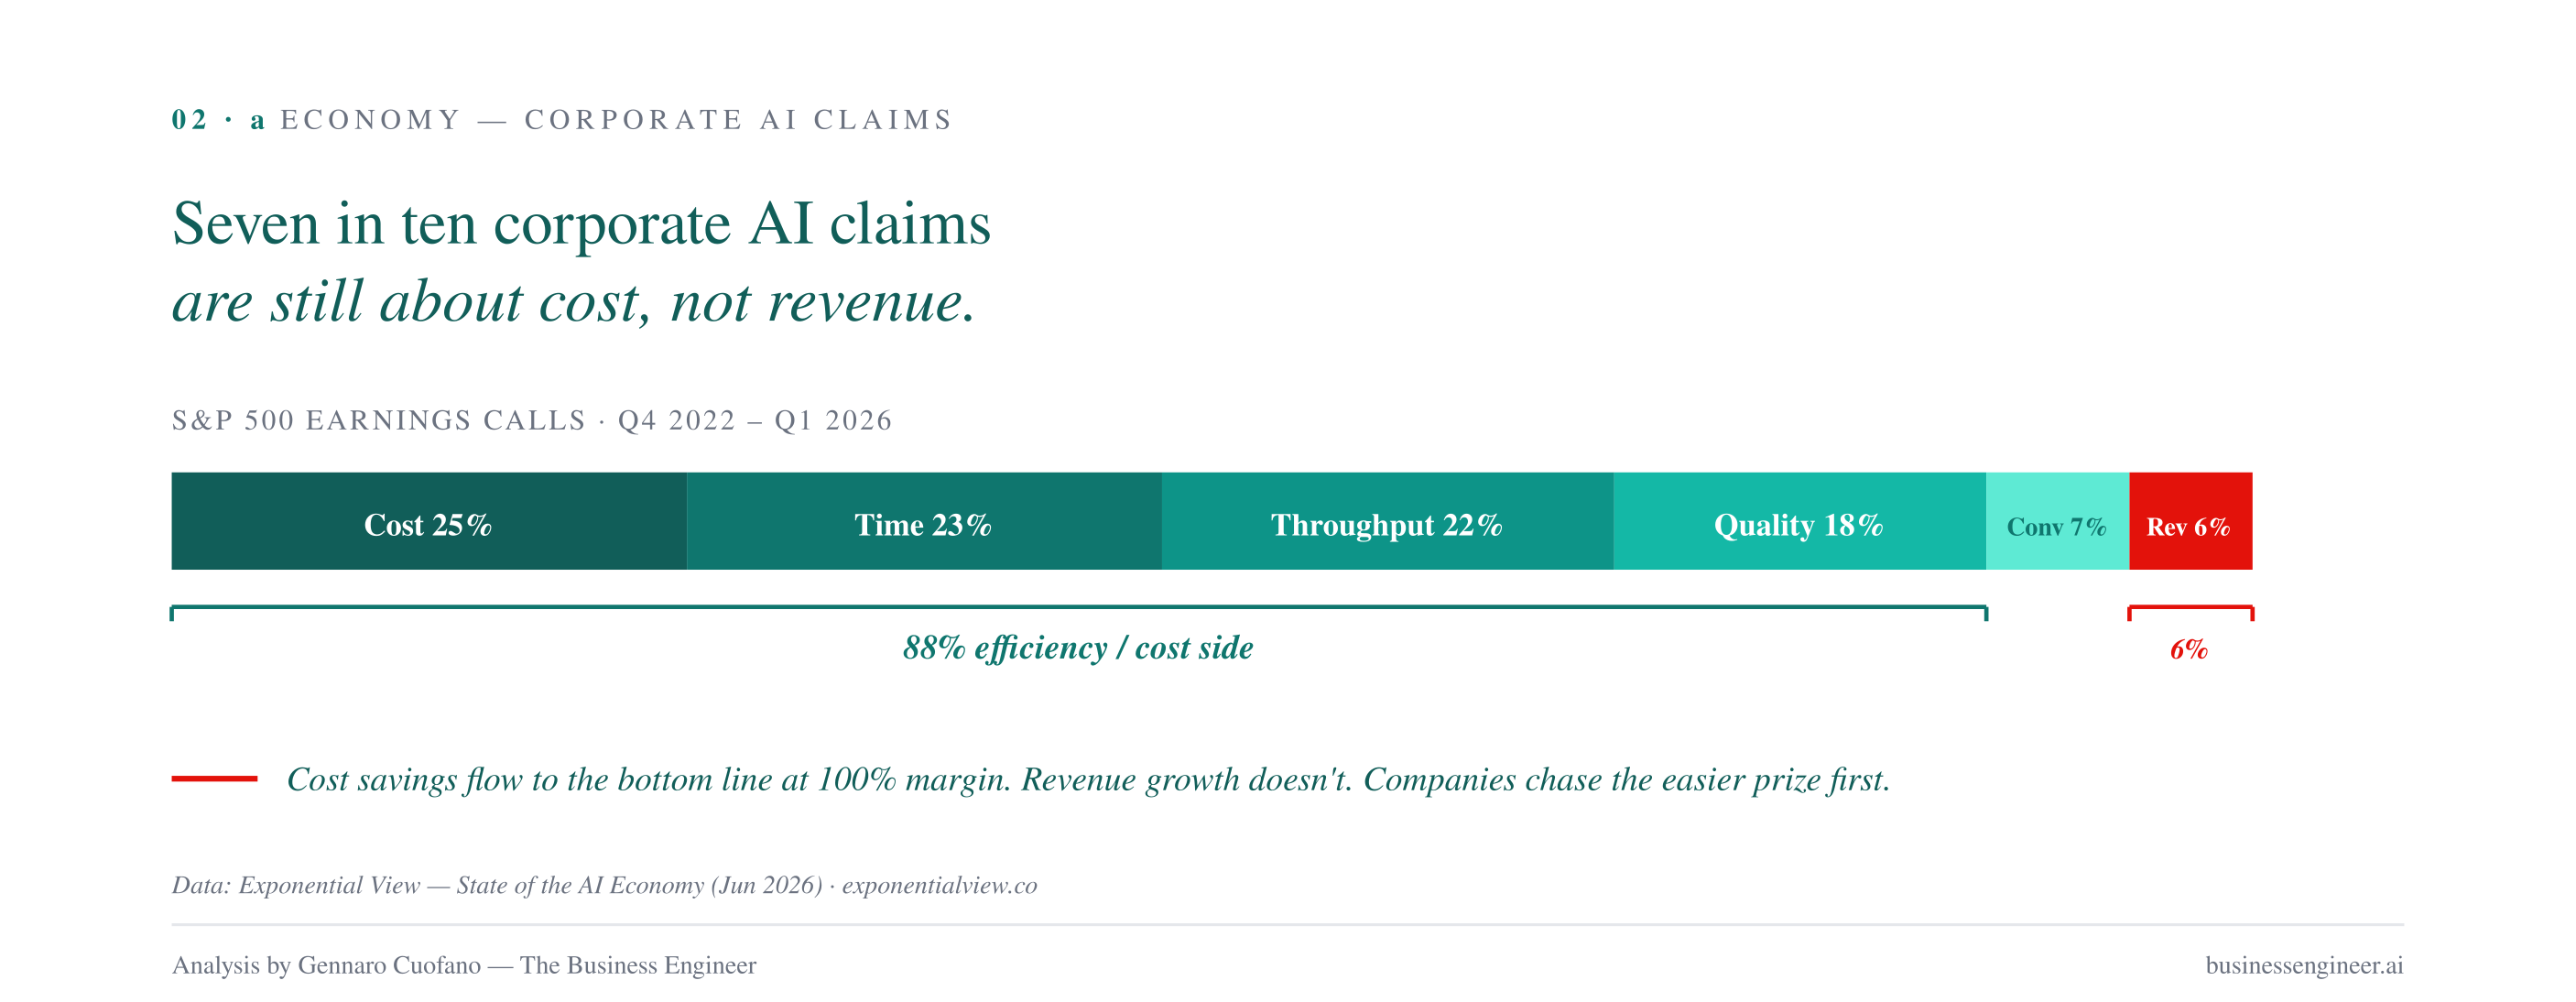
Exponential View parsed S&P 500 earnings calls from Q4 2022 to Q1 2026 and coded every AI impact claim. The distribution is telling: 25% cost reduction, 23% time savings, 22% throughput, 18% quality, 7% conversion, and just 6% revenue gain.
Roughly 70% of corporate GenAI claims are efficiency plays. Only 6% are top-line revenue claims. This matches every prior general-purpose technology cycle — companies chase the cost side first because a $1M saving flows to the bottom line at 100% margin, while a $1M revenue gain comes with cost of sales. But it also means the growth story you hear from the tech supply side is not yet the growth story you see in enterprise P&Ls.
The consumer surplus is a $3–4B/month invisible economy
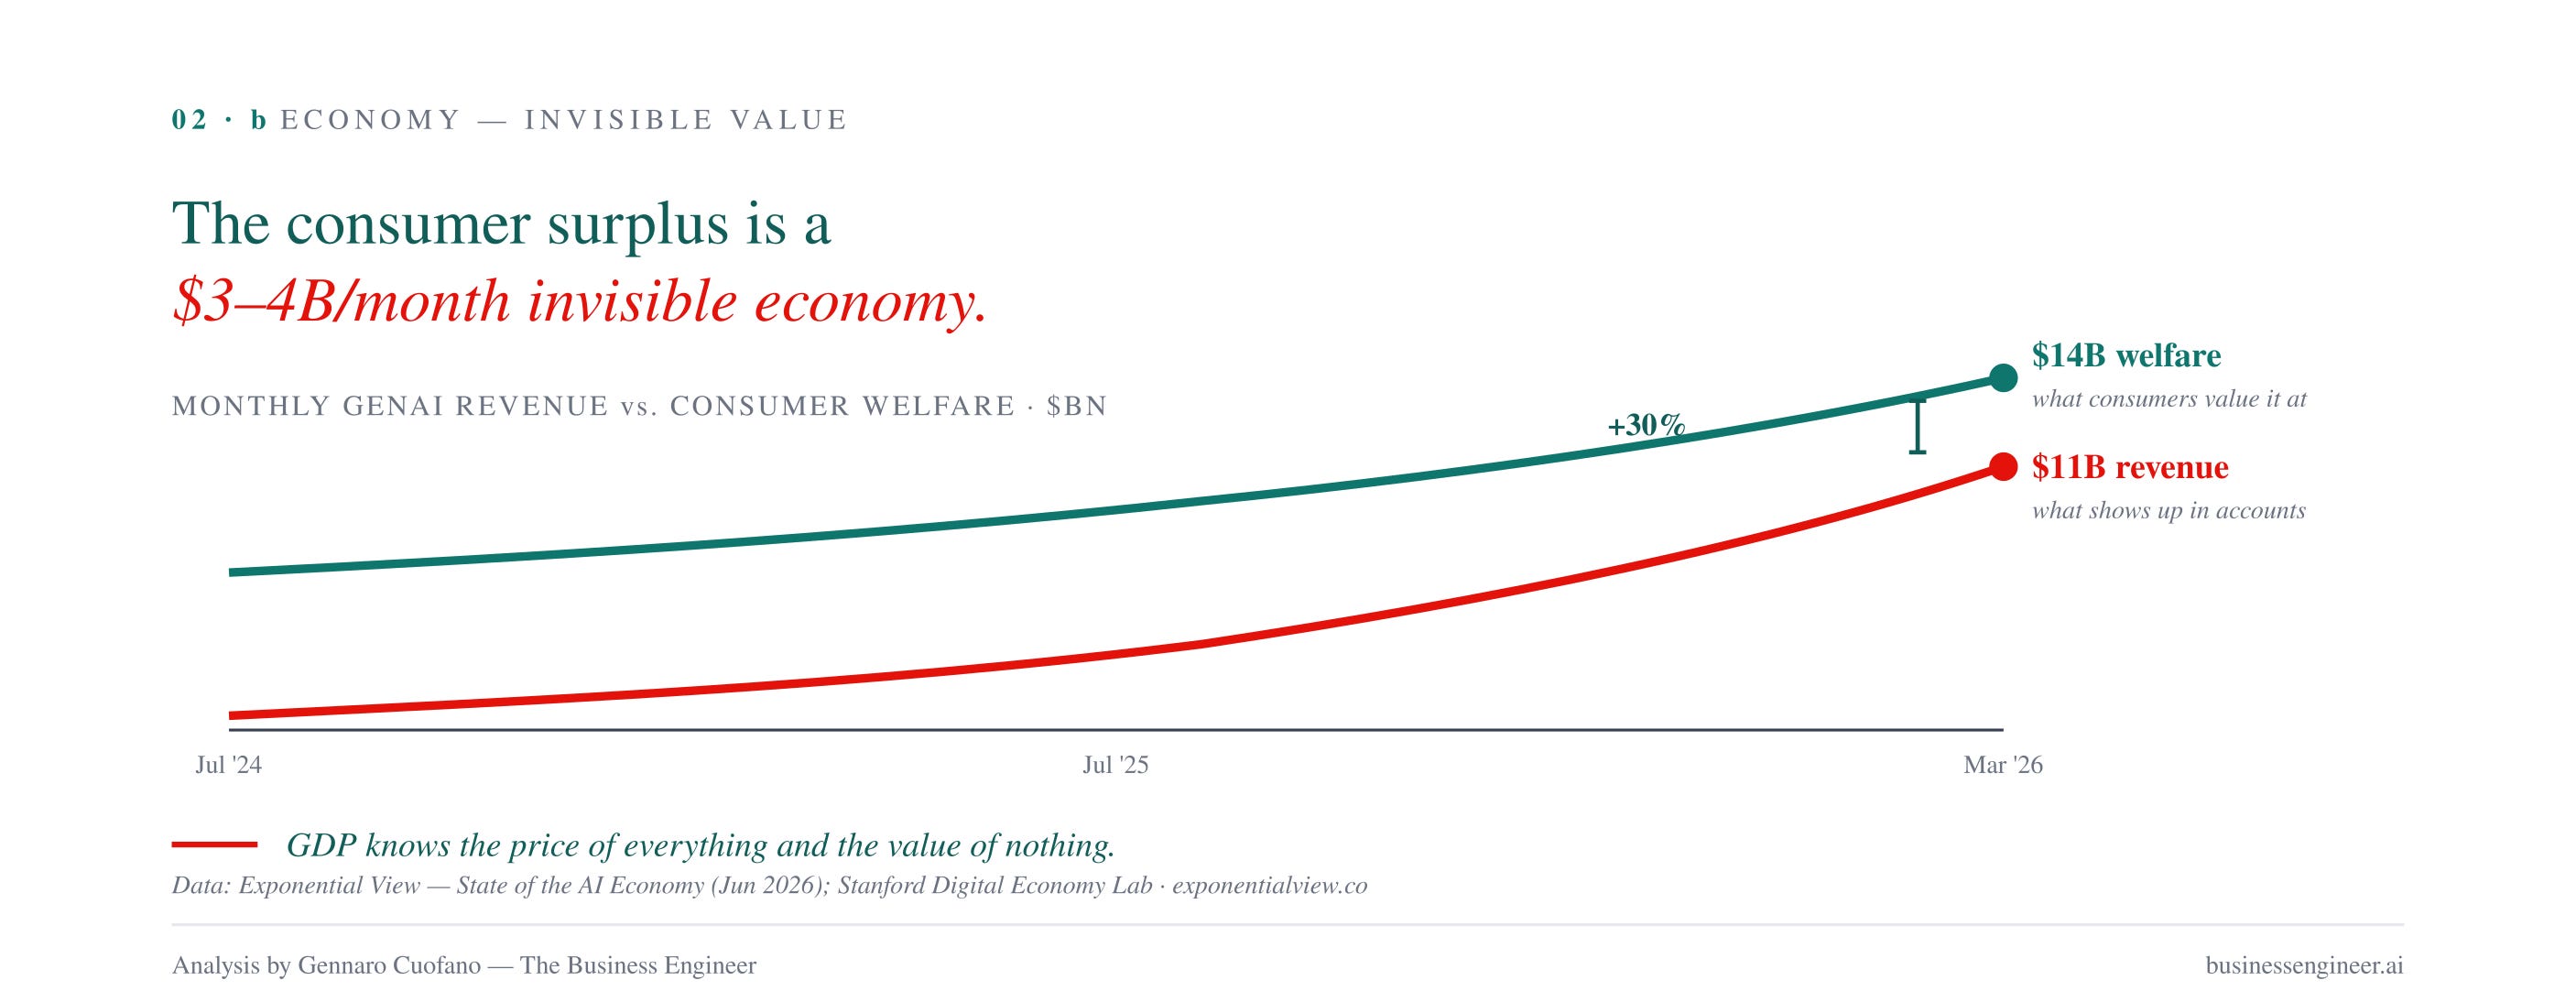
The Stanford Digital Economy Lab, led by Erik Brynjolfsson, has been running the “how much would you need to be paid to give up all AI tools for a month?” study. Applied to US consumer welfare, they estimate GenAI is producing ~$14B/month of consumer surplus against ~$11B/month of measured revenue.
That is roughly $3–4B/month of value that never touches anyone’s income statement — a 30% uplift on top of the reported revenue that GDP has no way to capture.
The historical analogies are worth naming. Between 1880 and 1920, electric light became ~99.97% cheaper. An hour’s wage bought 40,000x more light. The direct GDP impact was approximately zero, because the pricing collapsed faster than the volume expanded in the accounts. Between 2000 and 2020, free search, encyclopedias, and maps displaced paid alternatives — Google Search alone generates an estimated $17.5k/year/person of consumer surplus that shows up nowhere. GDP knows the price of everything and the value of nothing.
The Compression: A growing GenAI economy is not automatically good news for OpenAI, Anthropic, or the hyperscalers. But it is unambiguously good news for consumers — and that value is real, permanent, and mostly invisible in the official statistics.
CapEx: The Largest Buildout in Tech History Is Paying Back — For Now
Follow me on The AI Supercycle as well!
Here is where the tension in the AI Supercycle lives.
Cumulative hyperscaler + NeoCloud CapEx will reach ~$2 trillion through 2026. The 2026 figure alone is ~$848B, up from $459B in 2025 and $268B in 2024. Of that $848B, roughly $535B sits above the pre-AI trend line — that is the pure AI-attributable CapEx wedge.
And every major forecaster has spent the last three years chasing the actual number higher. The report shows the analyst forecast fan-out to 2030 — every line, from Barclays to JPMorgan to Morgan Stanley to Goldman, has been repeatedly revised higher as actuals have kept exceeding the previous consensus.
The financing shift is where systemic risk enters
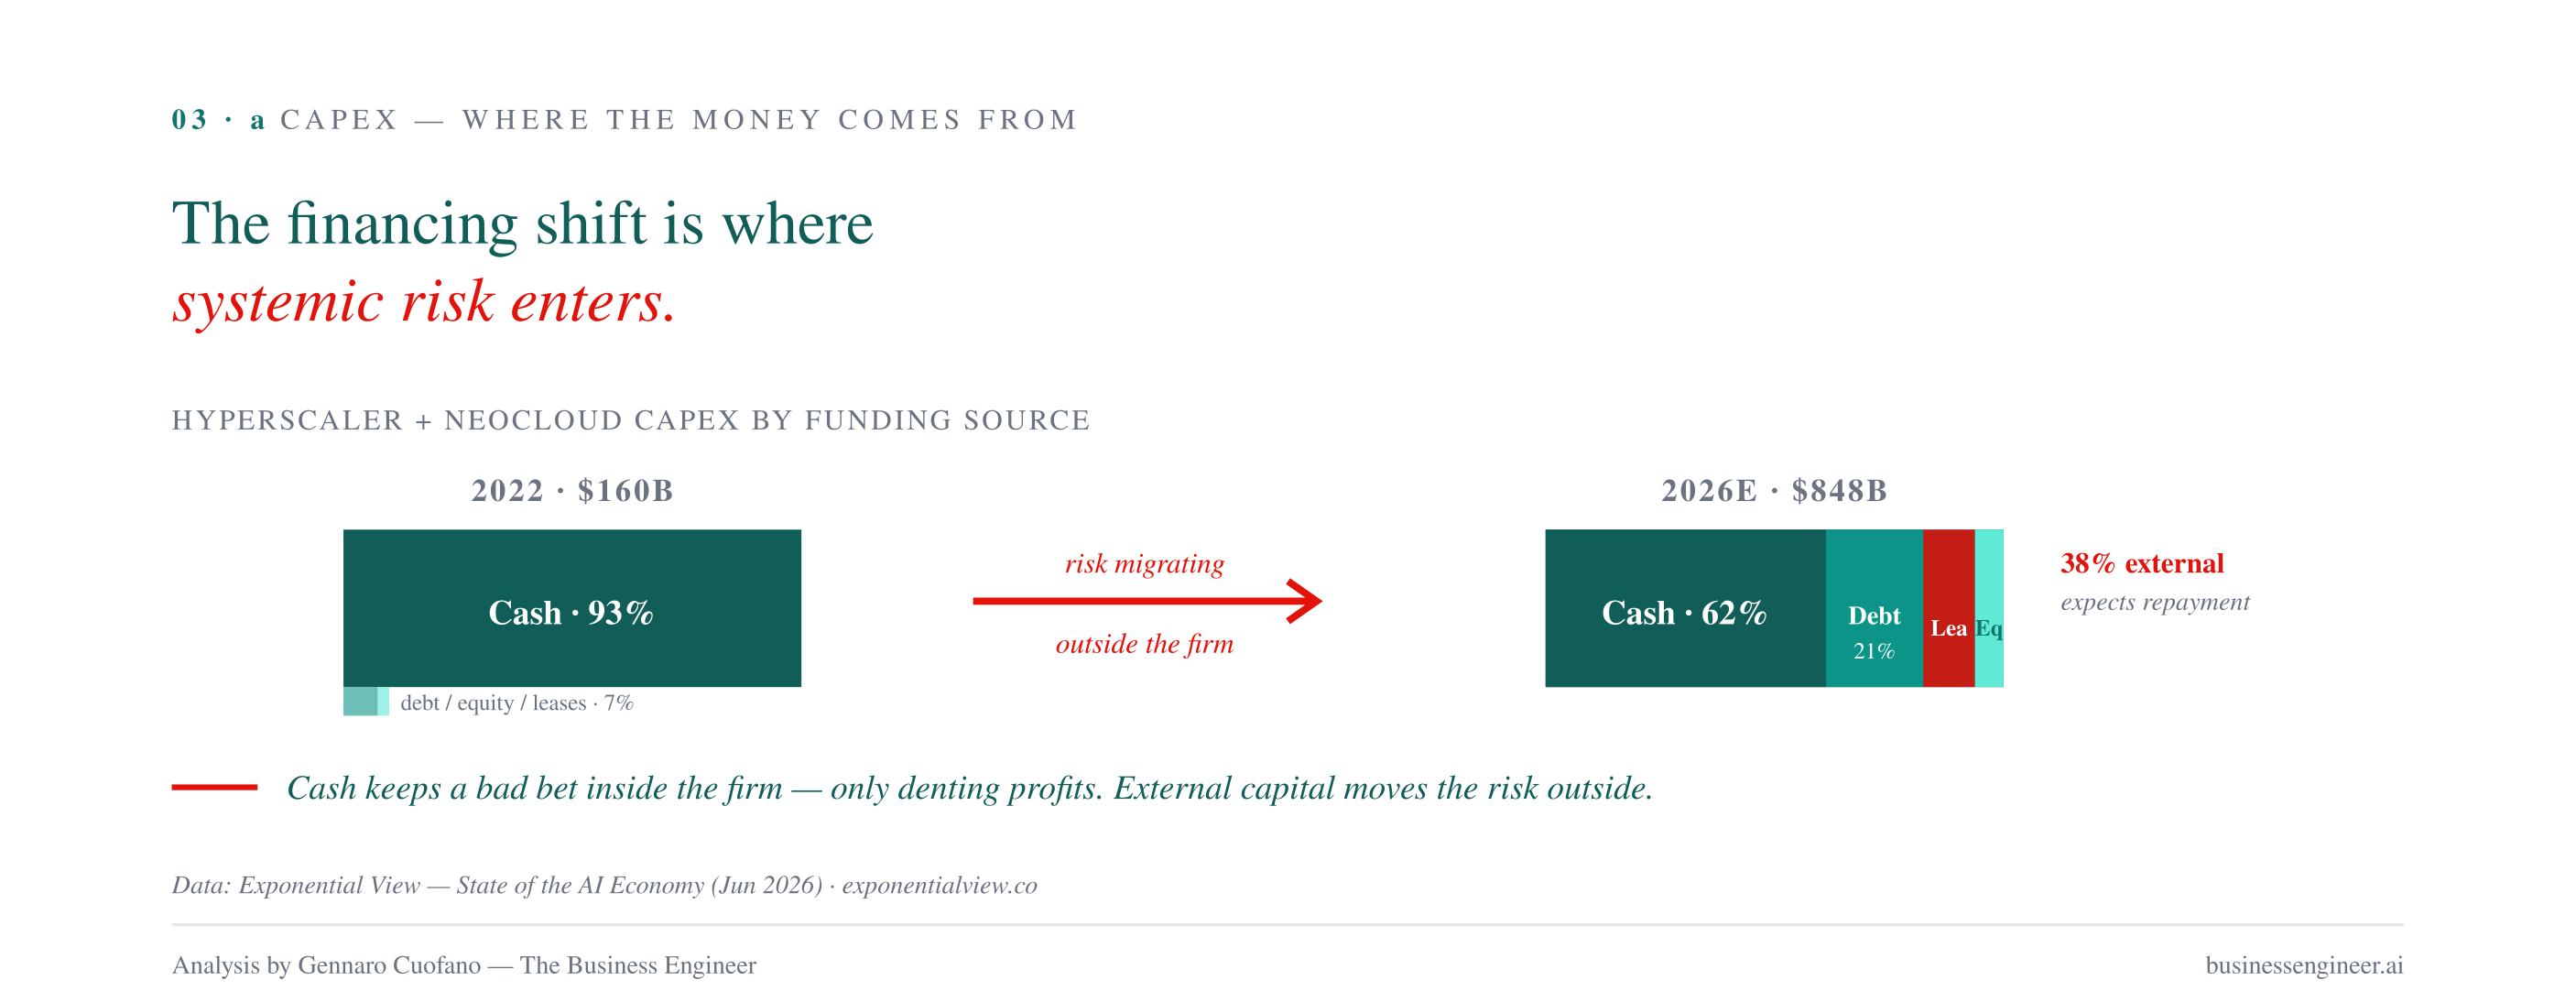
In 2022–2024, hyperscaler CapEx was overwhelmingly funded from operating cash flow. Hyperscalers were cash-rich. That’s changed. External capital — debt, equity, and leases — is now filling the marginal dollar. NeoCloud CapEx is primarily debt-funded. Even hyperscaler CapEx now shows a growing debt and lease component, especially at Oracle and Meta.
The report is precise about what this means: paying cash keeps a bad bet inside the firm — only denting profits. External funding moves the risk outside the firm, where third parties expect repayment. As external financing grows, the interconnectivity of the AI economy with the wider financial system grows with it. That is the mechanism by which a localized underperformance in one layer becomes a broader problem.
The depreciation waterfall is the honest test
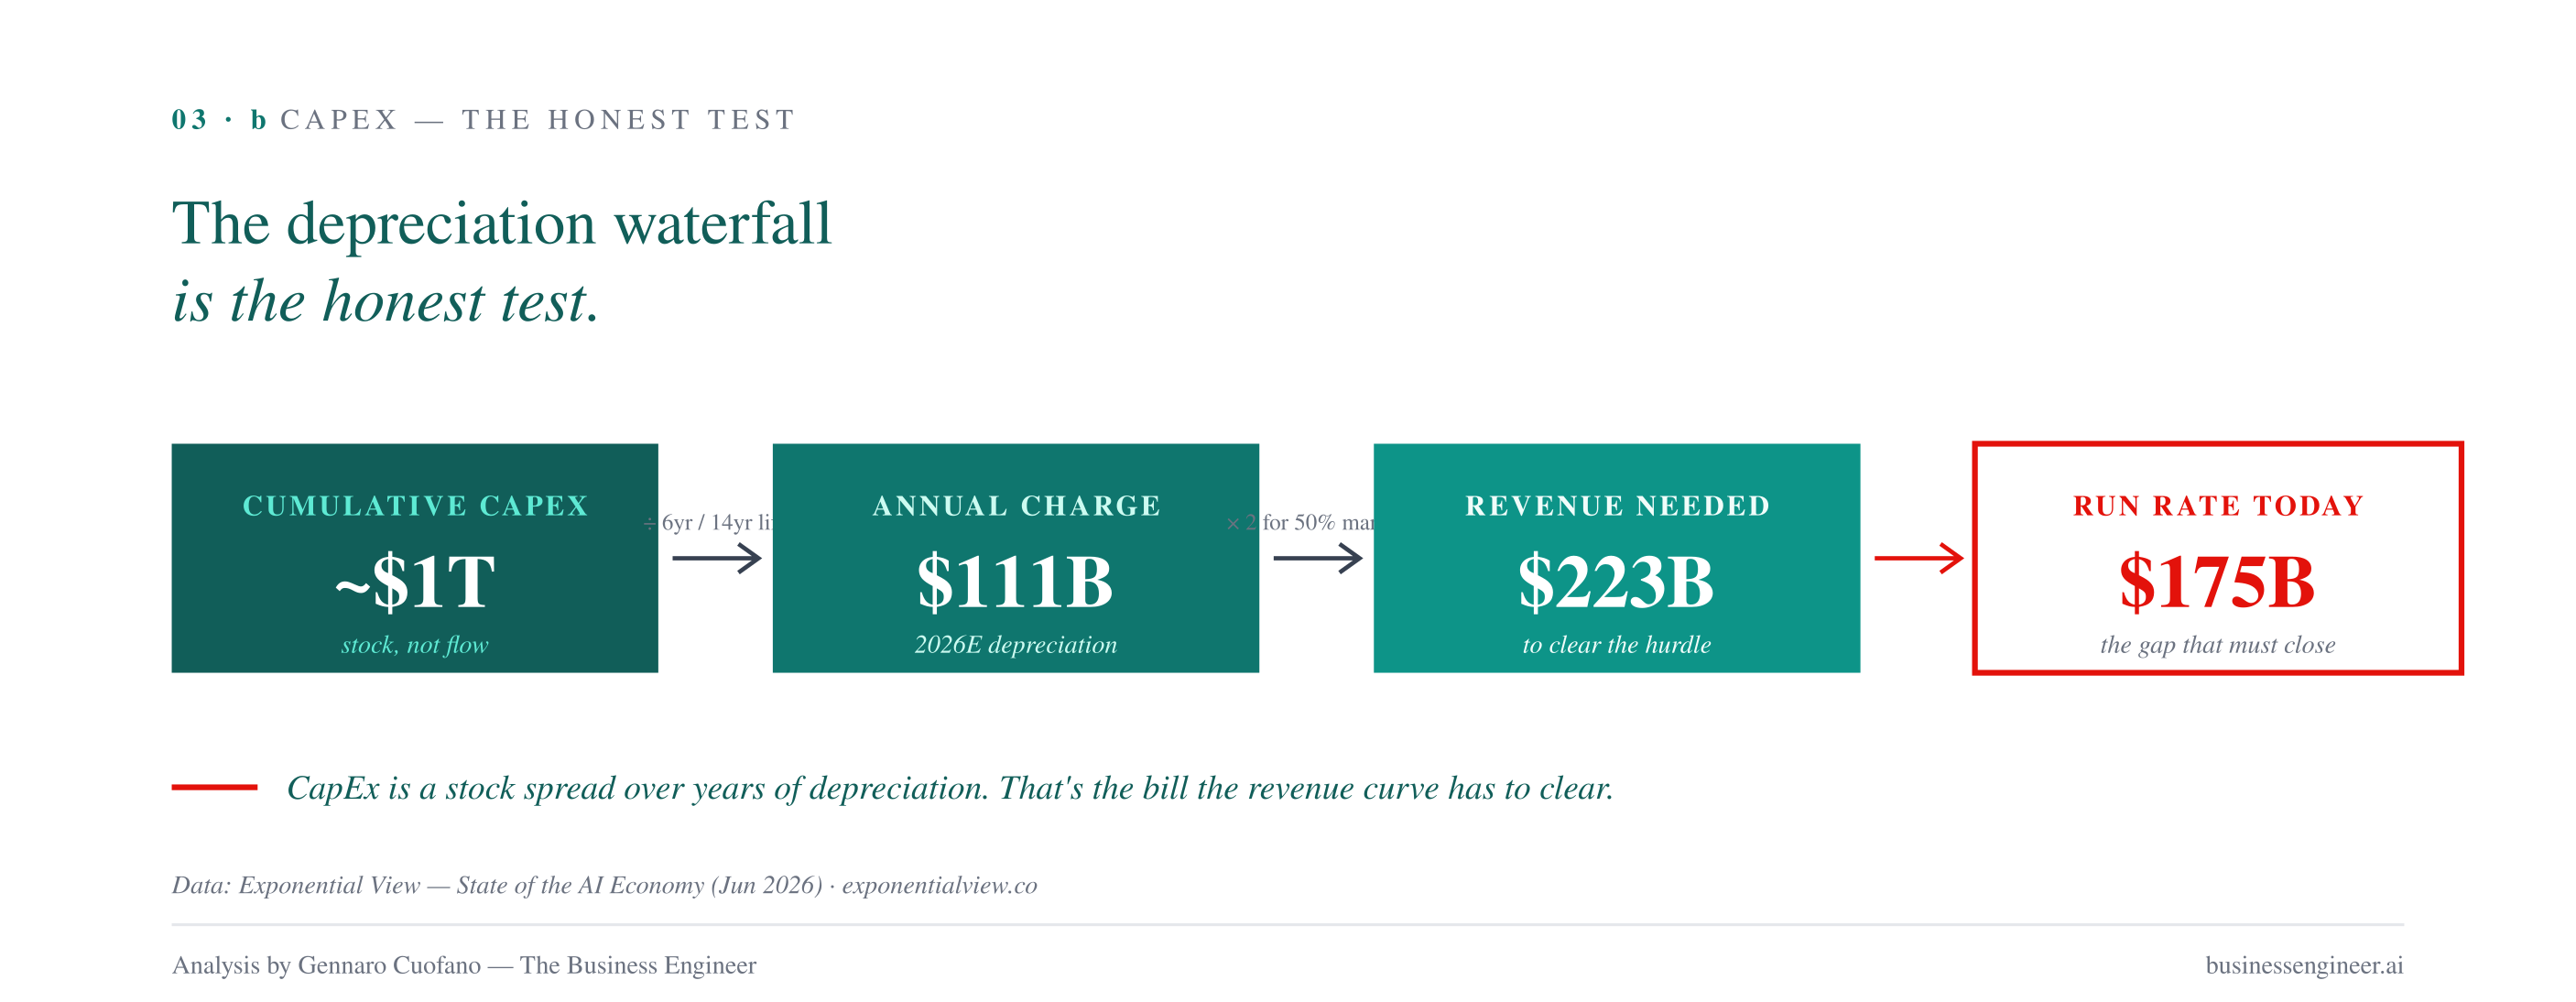
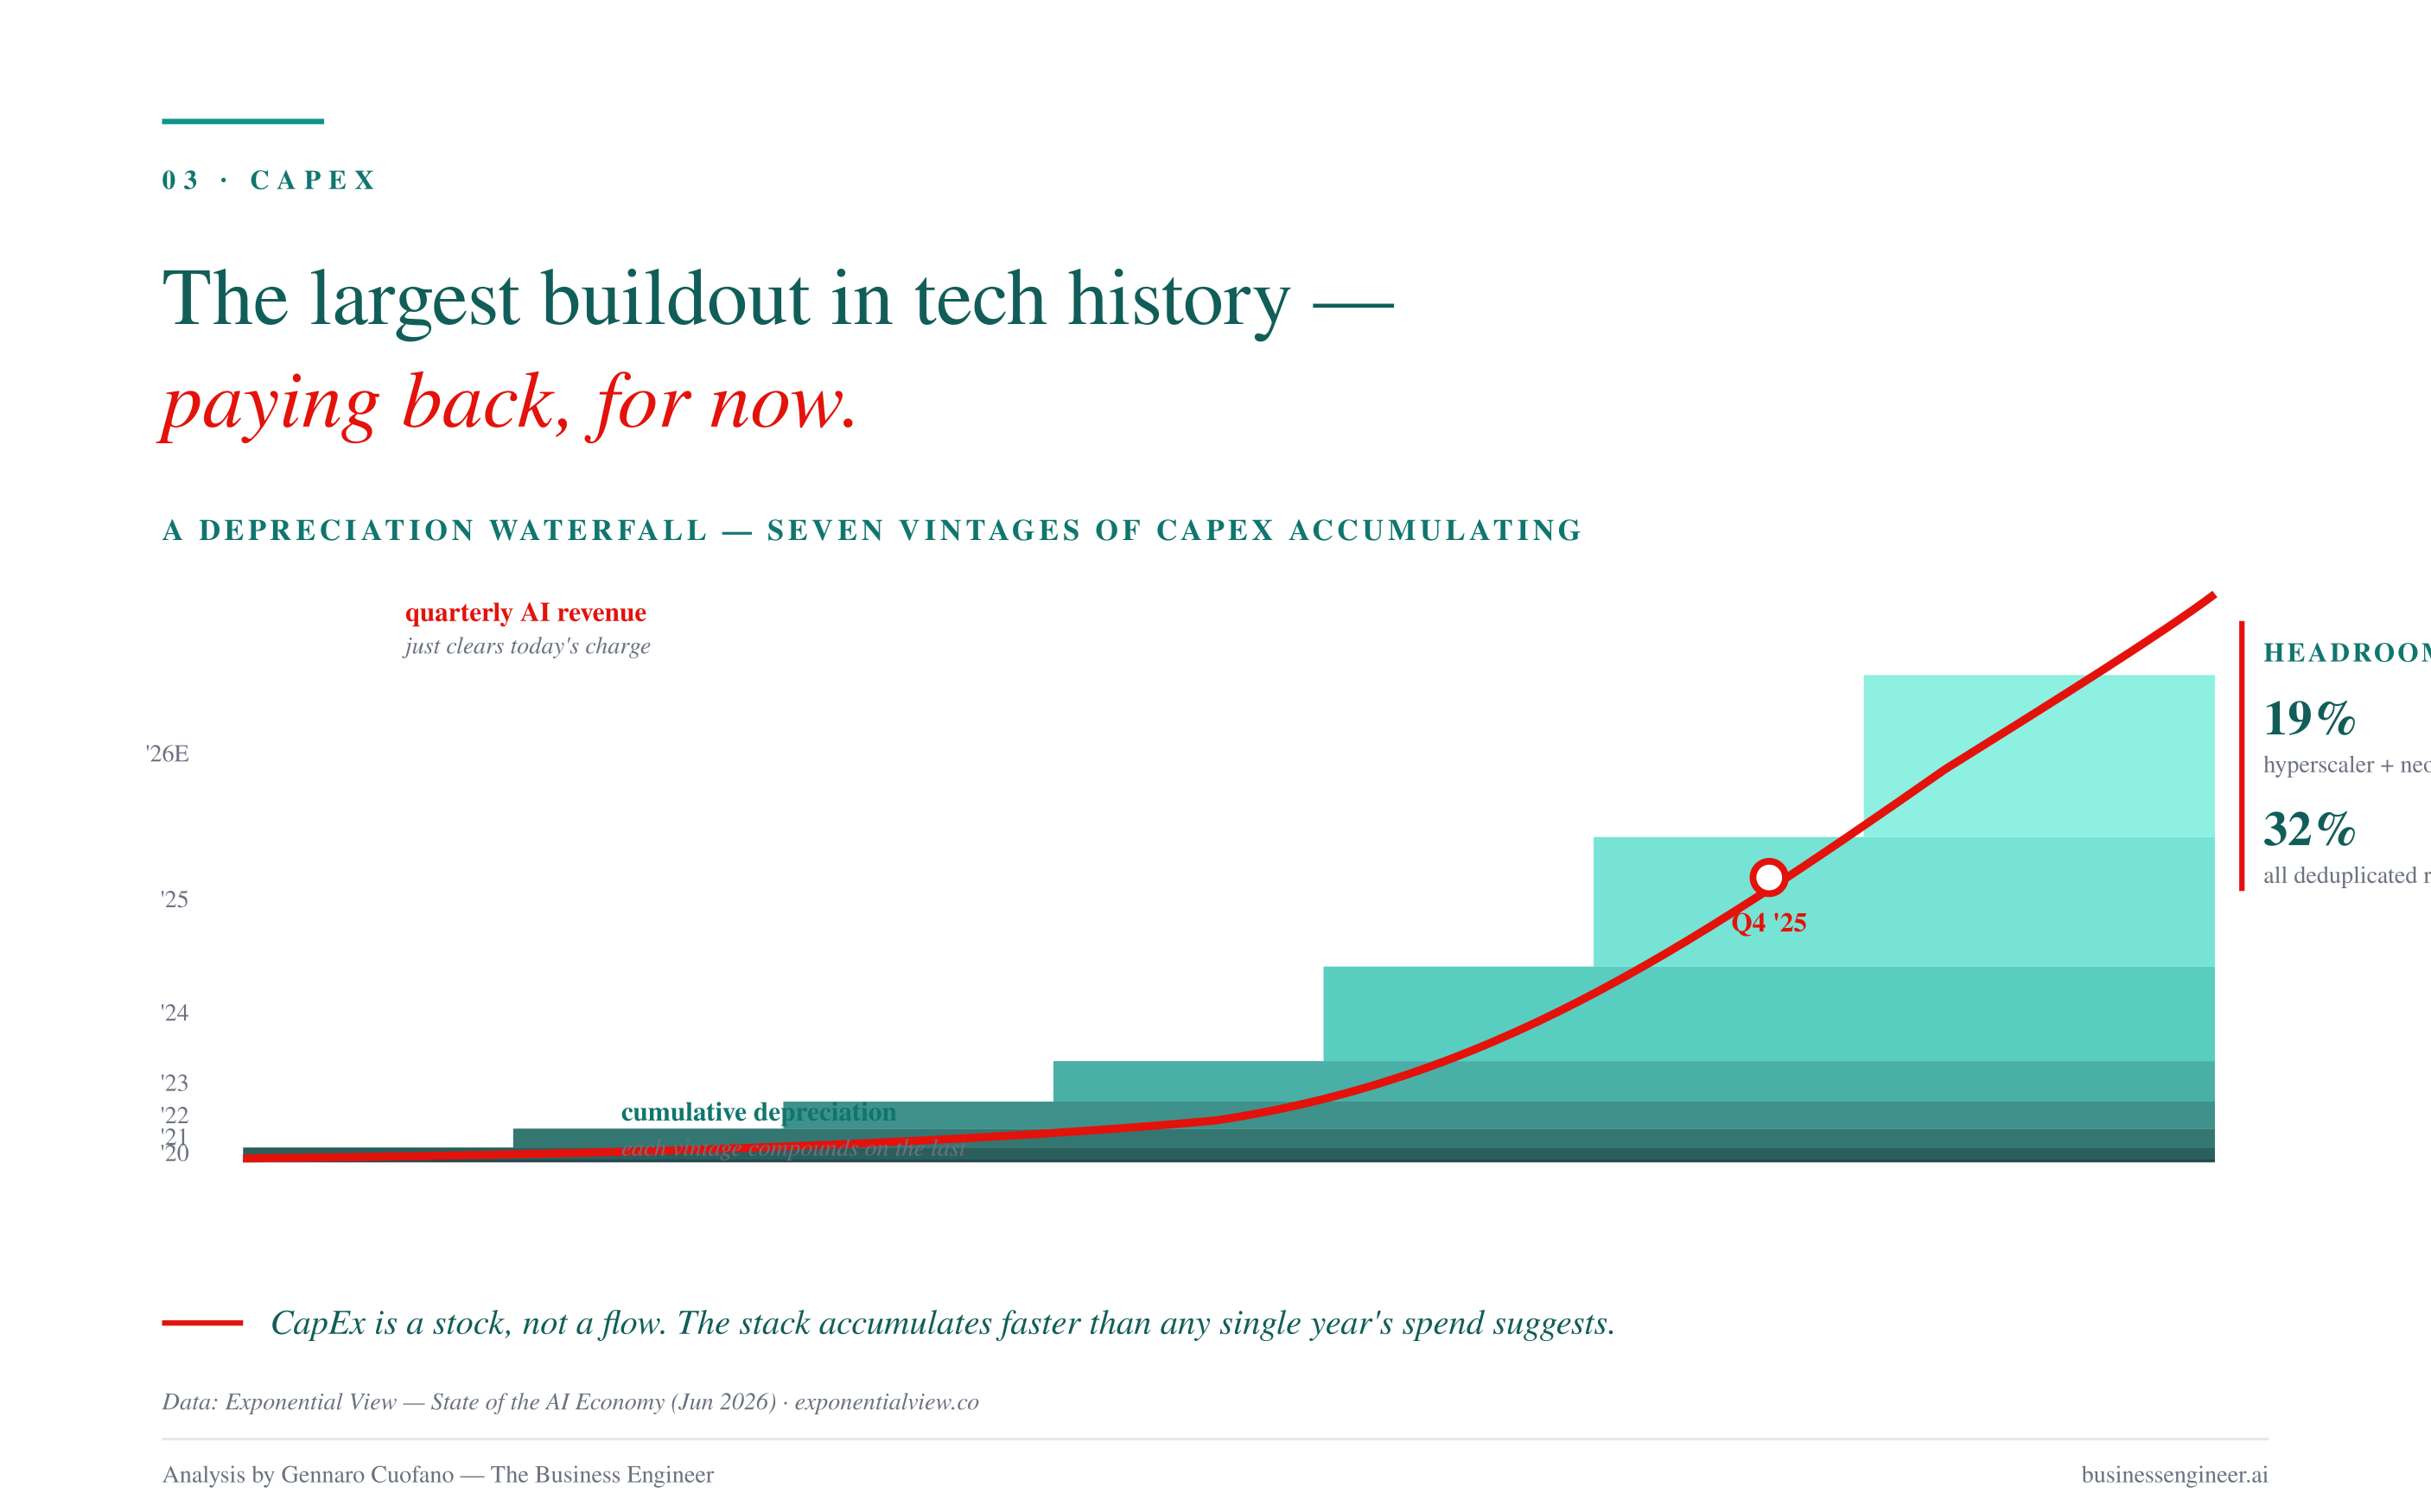
If you want to answer “is the AI CapEx paying back?” you cannot compare this year’s spend to this year’s revenue. CapEx is a stock; you build the data center once, and depreciate it over 6 years for chips, 14 years for the building envelope. Each year, only a fraction of the spend passes through as a cost — but that fraction accumulates.
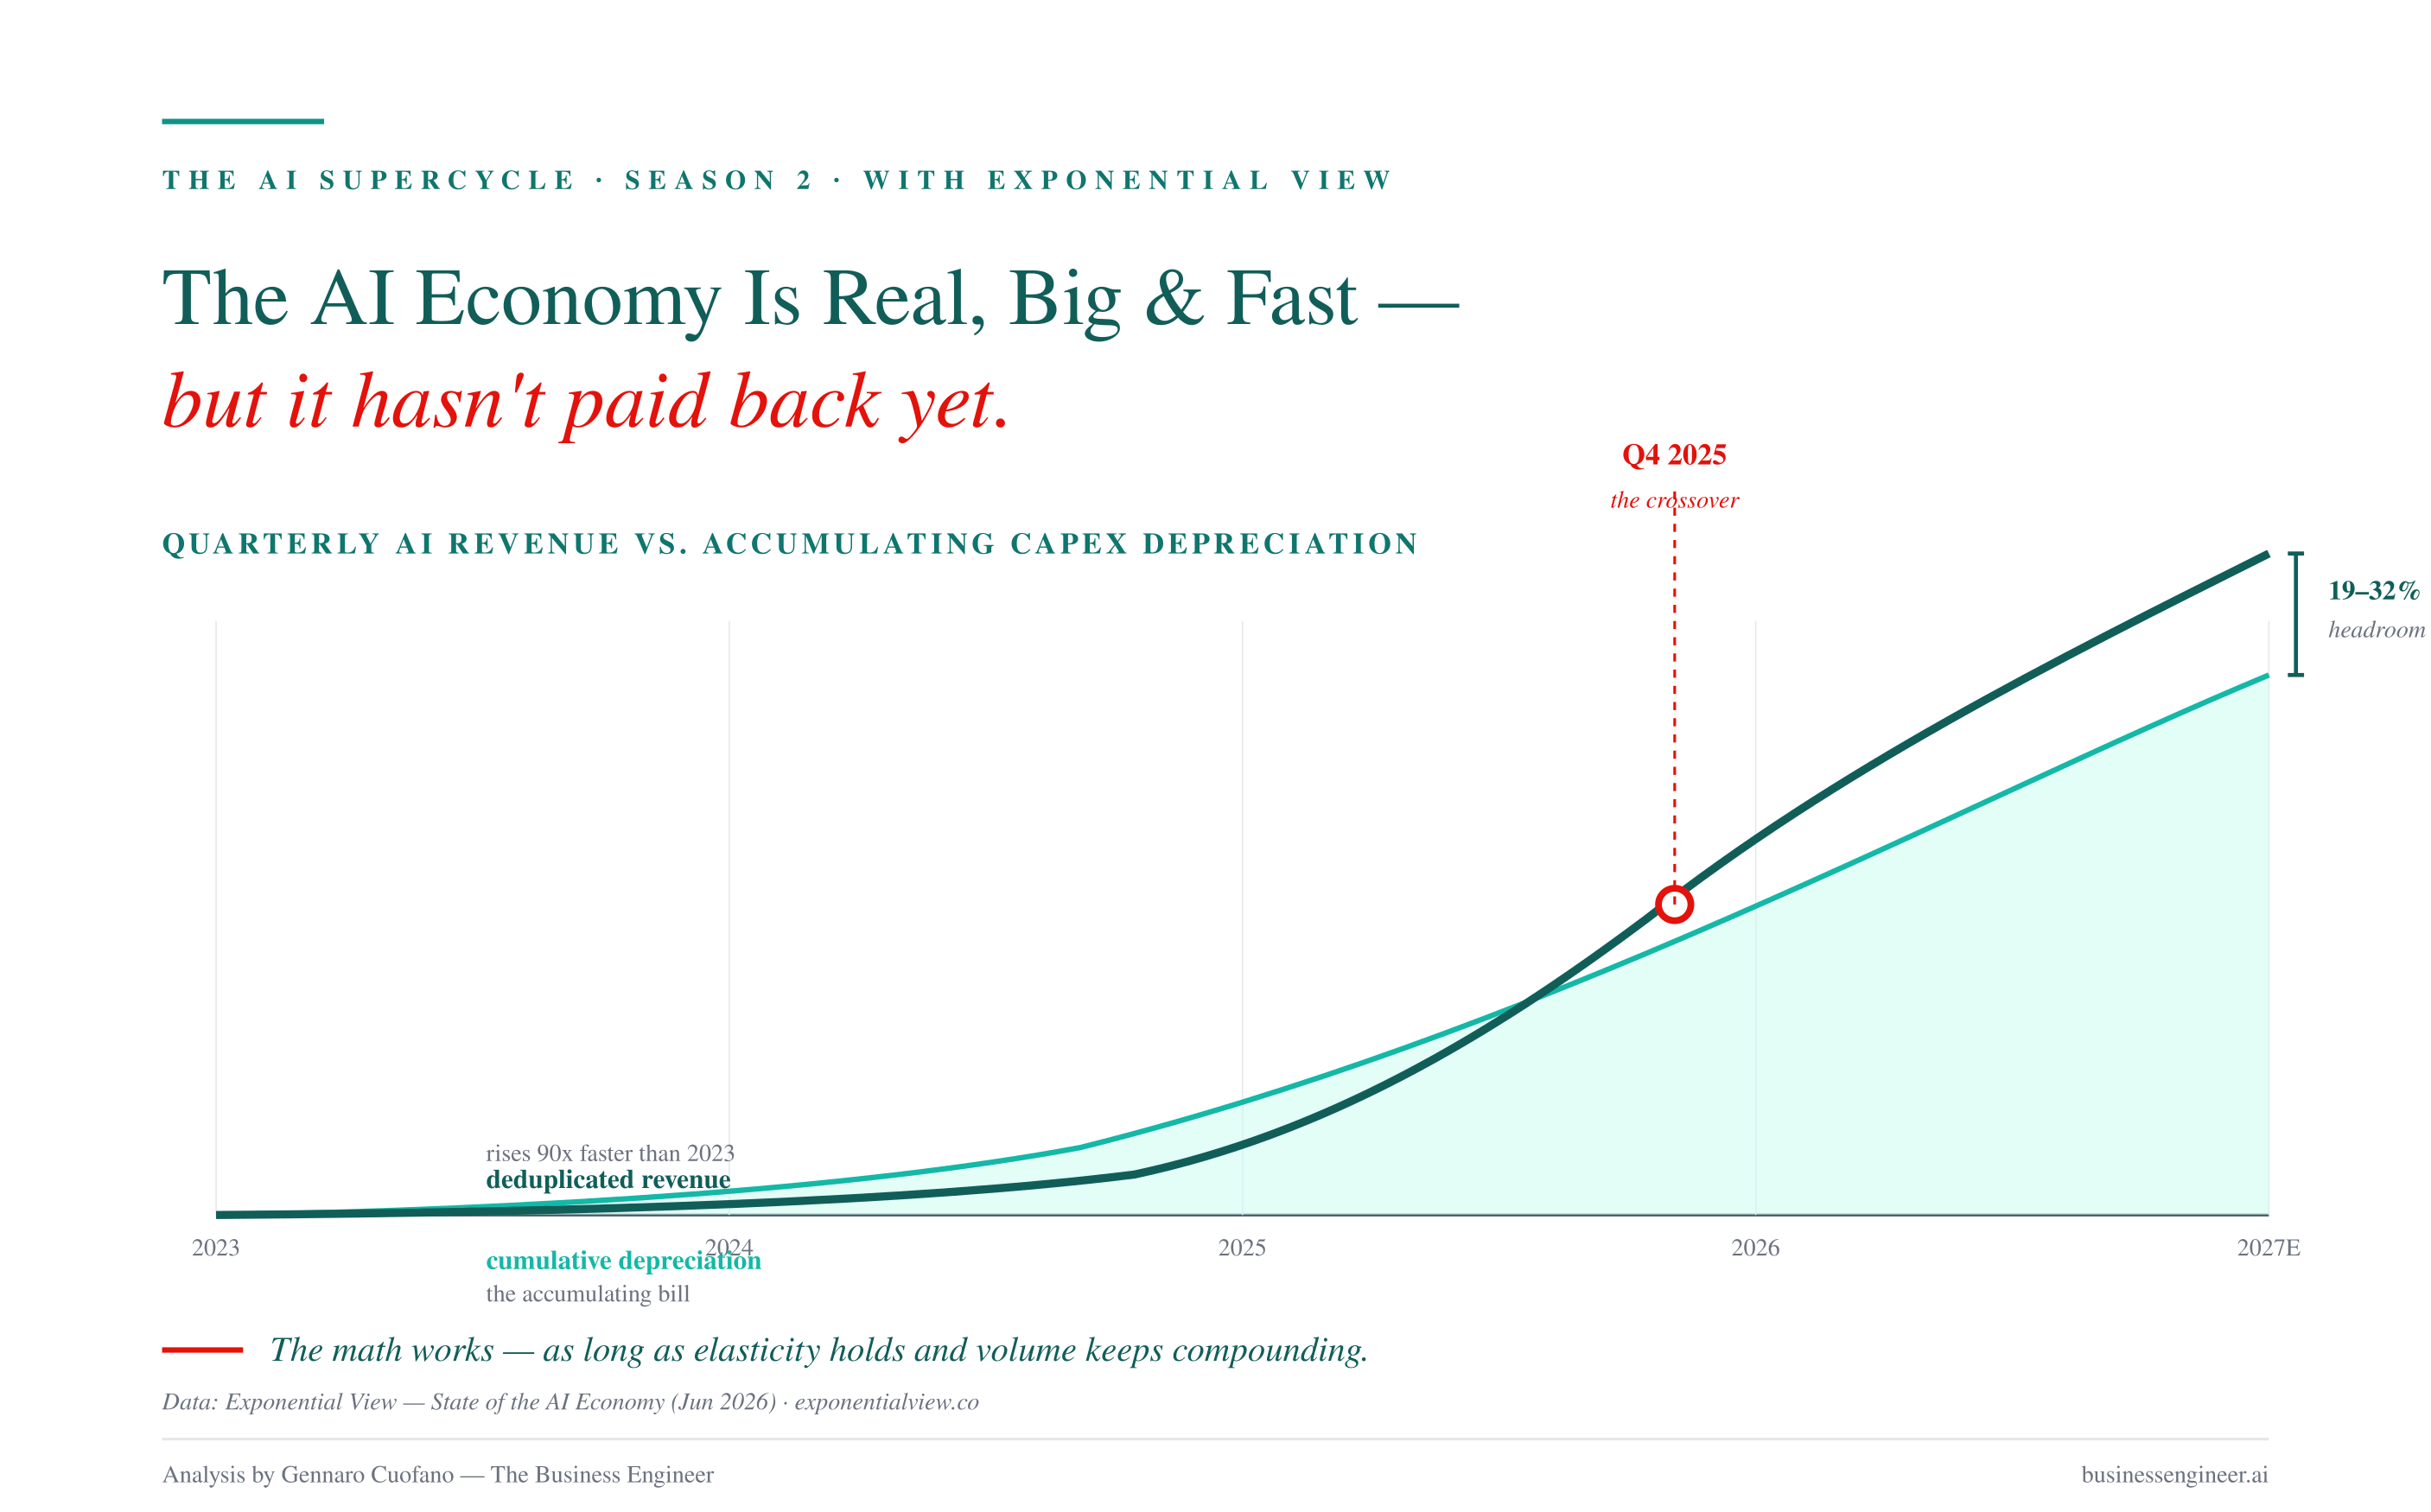
The report’s depreciation waterfall shows this beautifully. The 2026E annual AI CapEx depreciation charge reaches ~$111B — but it took cumulative CapEx of ~$1 trillion to get there. And to justify that depreciation with 50% infrastructure margin headroom, the industry needs ~$223B/year of revenue supporting it.
Here’s the crossing point that matters: In Q4 2025, for the first time, quarterly AI revenue exceeded quarterly AI CapEx depreciation. By Q1 2026, hyperscaler + NeoCloud AI revenue has 19% headroom over depreciation. Across all GenAI revenues (including the app and model layers), the headroom is 32%.
That is the punchline of the CapEx chapter, and the reason the subtitle is “paying back (for now)“. The current buildout is being covered by the current revenue run rate. What’s not yet covered is the cumulative bill — the accumulating depreciation stack from prior years — plus the additional capacity that hasn’t yet come online.
Two mechanical levers can rescue the math
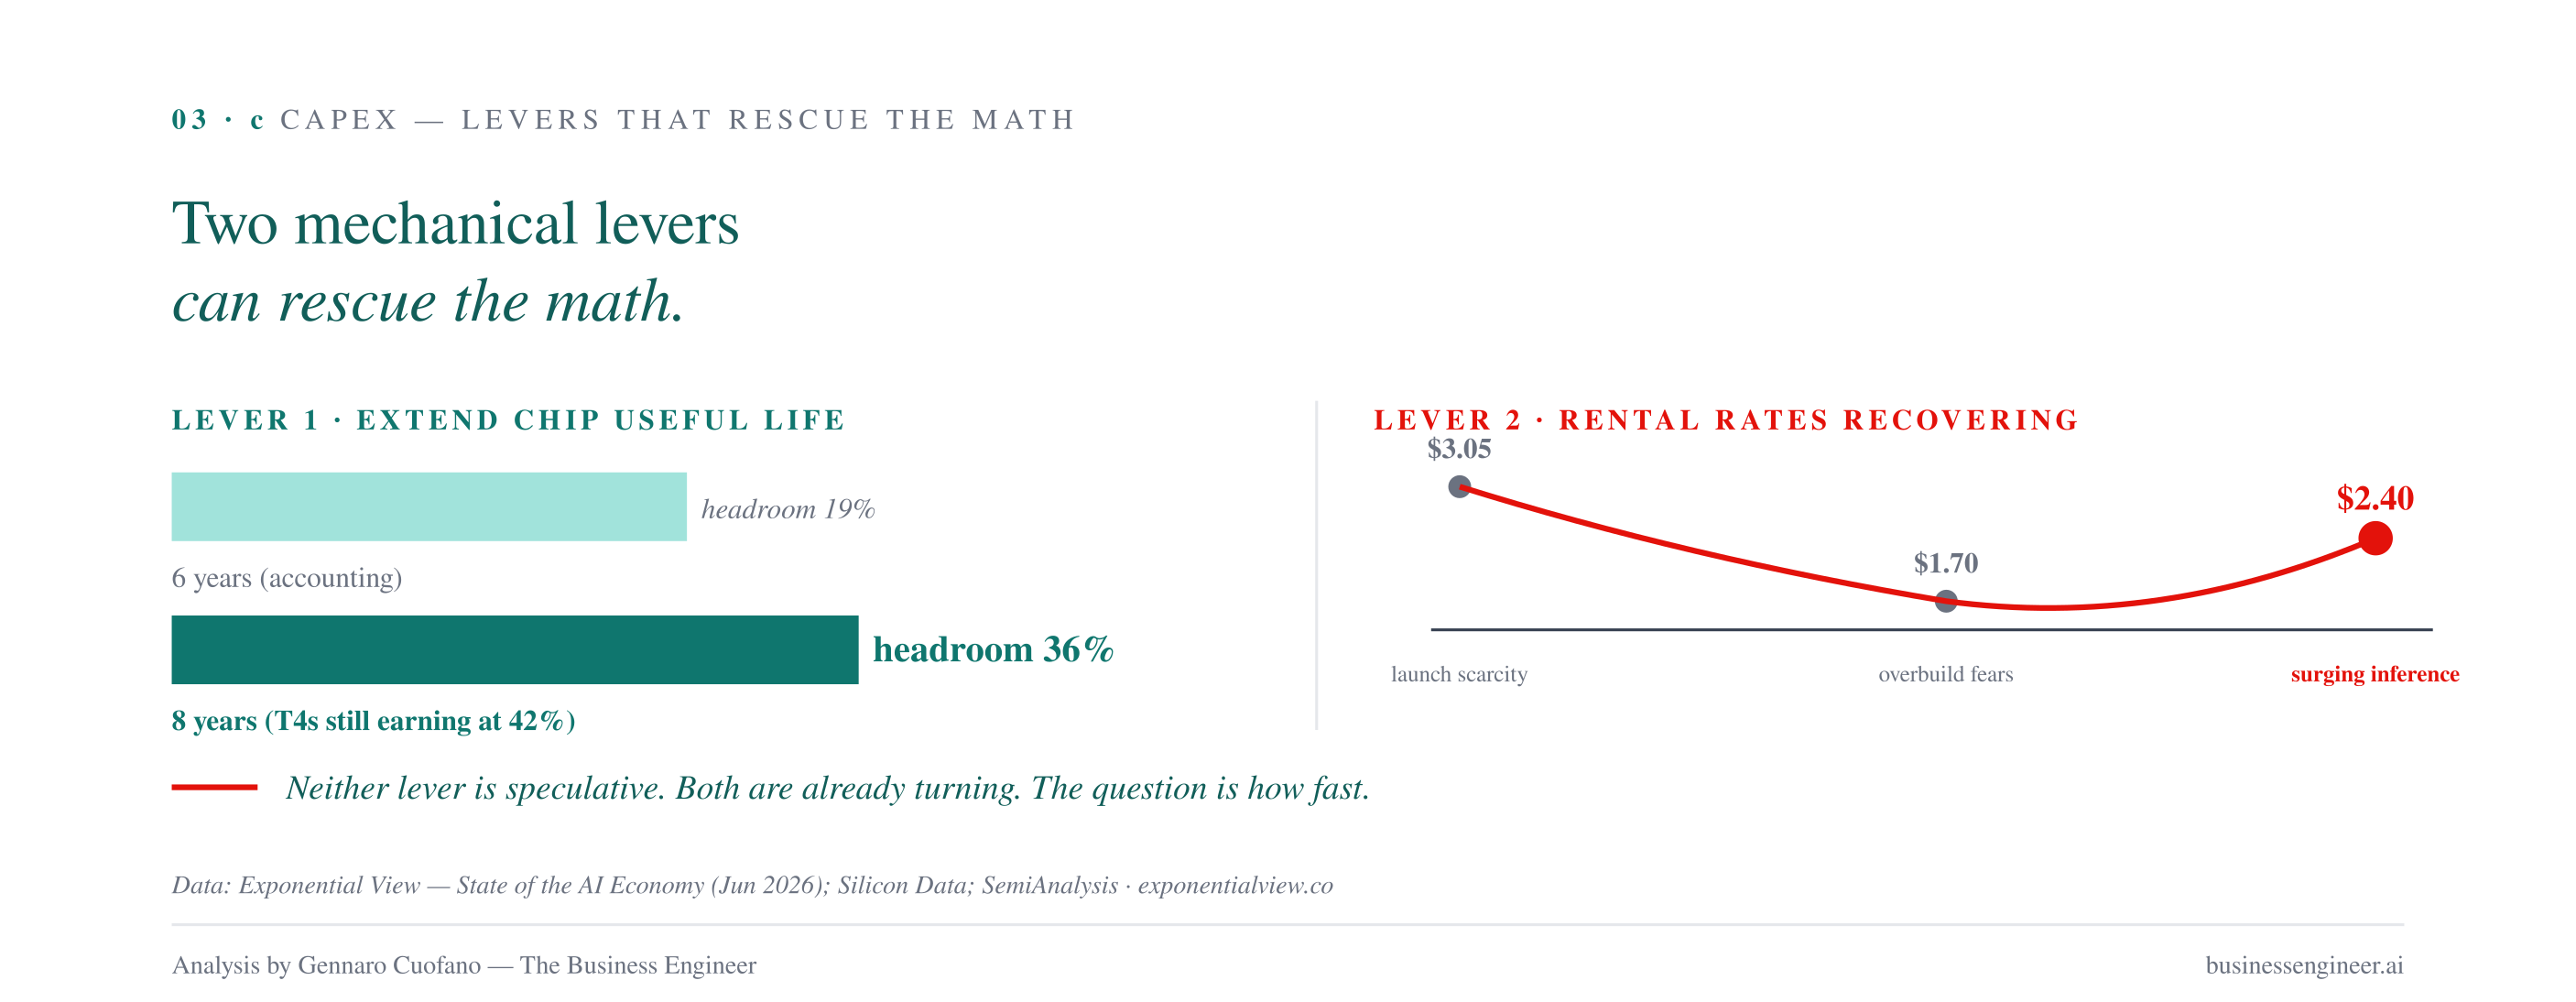
Longer chip useful lives. Depreciation schedules assume 6 years for chips. If actual useful life is 8 years — supported by the fact that 8-year-old T4 GPUs still earn 42% gross rental yields — Q1 2026 infrastructure headroom moves from 19% to 36%. Every additional year of chip life materially compounds the payback.
Rising rental rates. H100 1-year rental contracts collapsed from a $3.05/hour launch premium to $1.70/hour peak-overbuild fear in mid-2025. In the last two quarters they’ve climbed back to $2.40/hour, driven by surging inference demand. That is what utilization catching up to supply looks like in real time.
The Compression: The AI CapEx race is not currently in bubble territory. It is in “revenue must keep compounding, or the depreciation stack catches up” territory. Those are very different states.
Tokens: The Unit of Value, and Why That Framing Is Almost Right
Follow me on The AI Supercycle as well!
Jensen Huang says the input is electrons and the output is tokens. Sundar Pichai calls tokens the fundamental unit of AI. It is the closest the industry has come to a shared unit of account.
The Exponential View position: sort of. Tokens are AI’s billing metric — but not yet a proper unit of value.
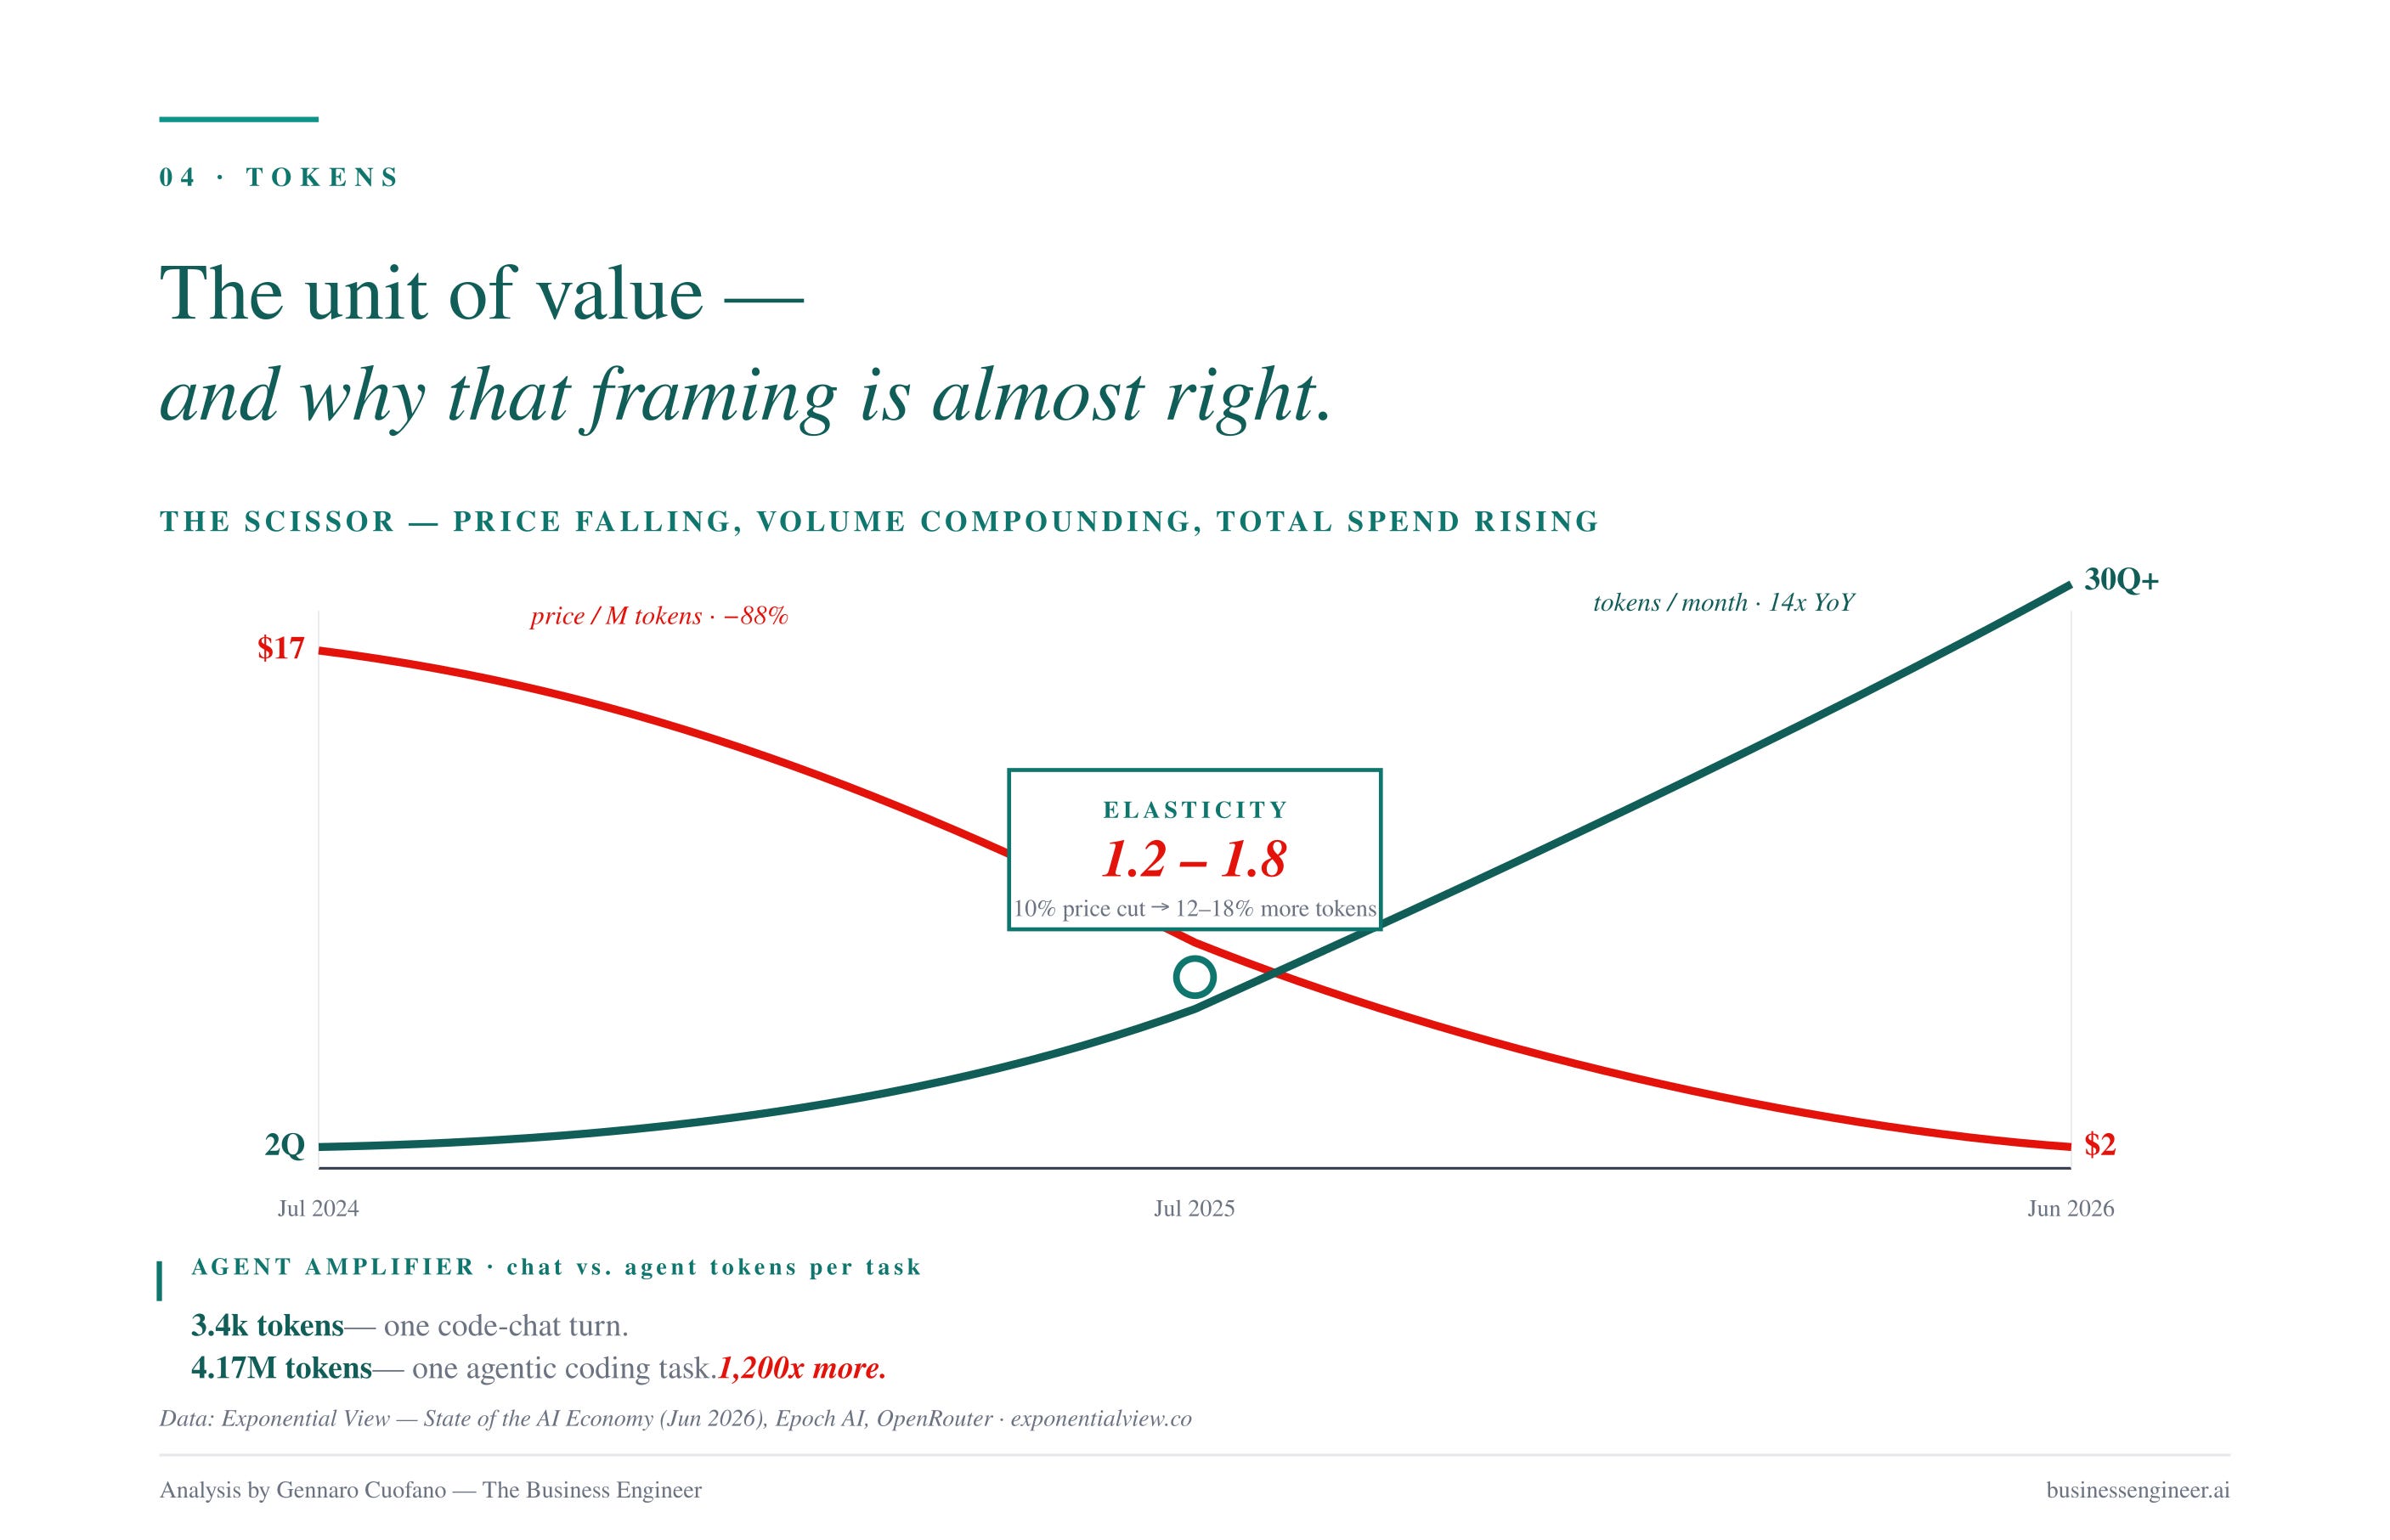
The numbers are staggering. Global inference token volume exceeded 30 quadrillion per month in mid-2026, growing 14x year-on-year. Blended API prices collapsed from ~$17 per million tokens to ~$2 over 18 months — a 90% decline for a given intelligence level. Meanwhile the Epoch Capabilities Index moved from 112 to 158 for frontier models. Cheaper AND better, at the same time.
Elasticity is what makes this cycle work
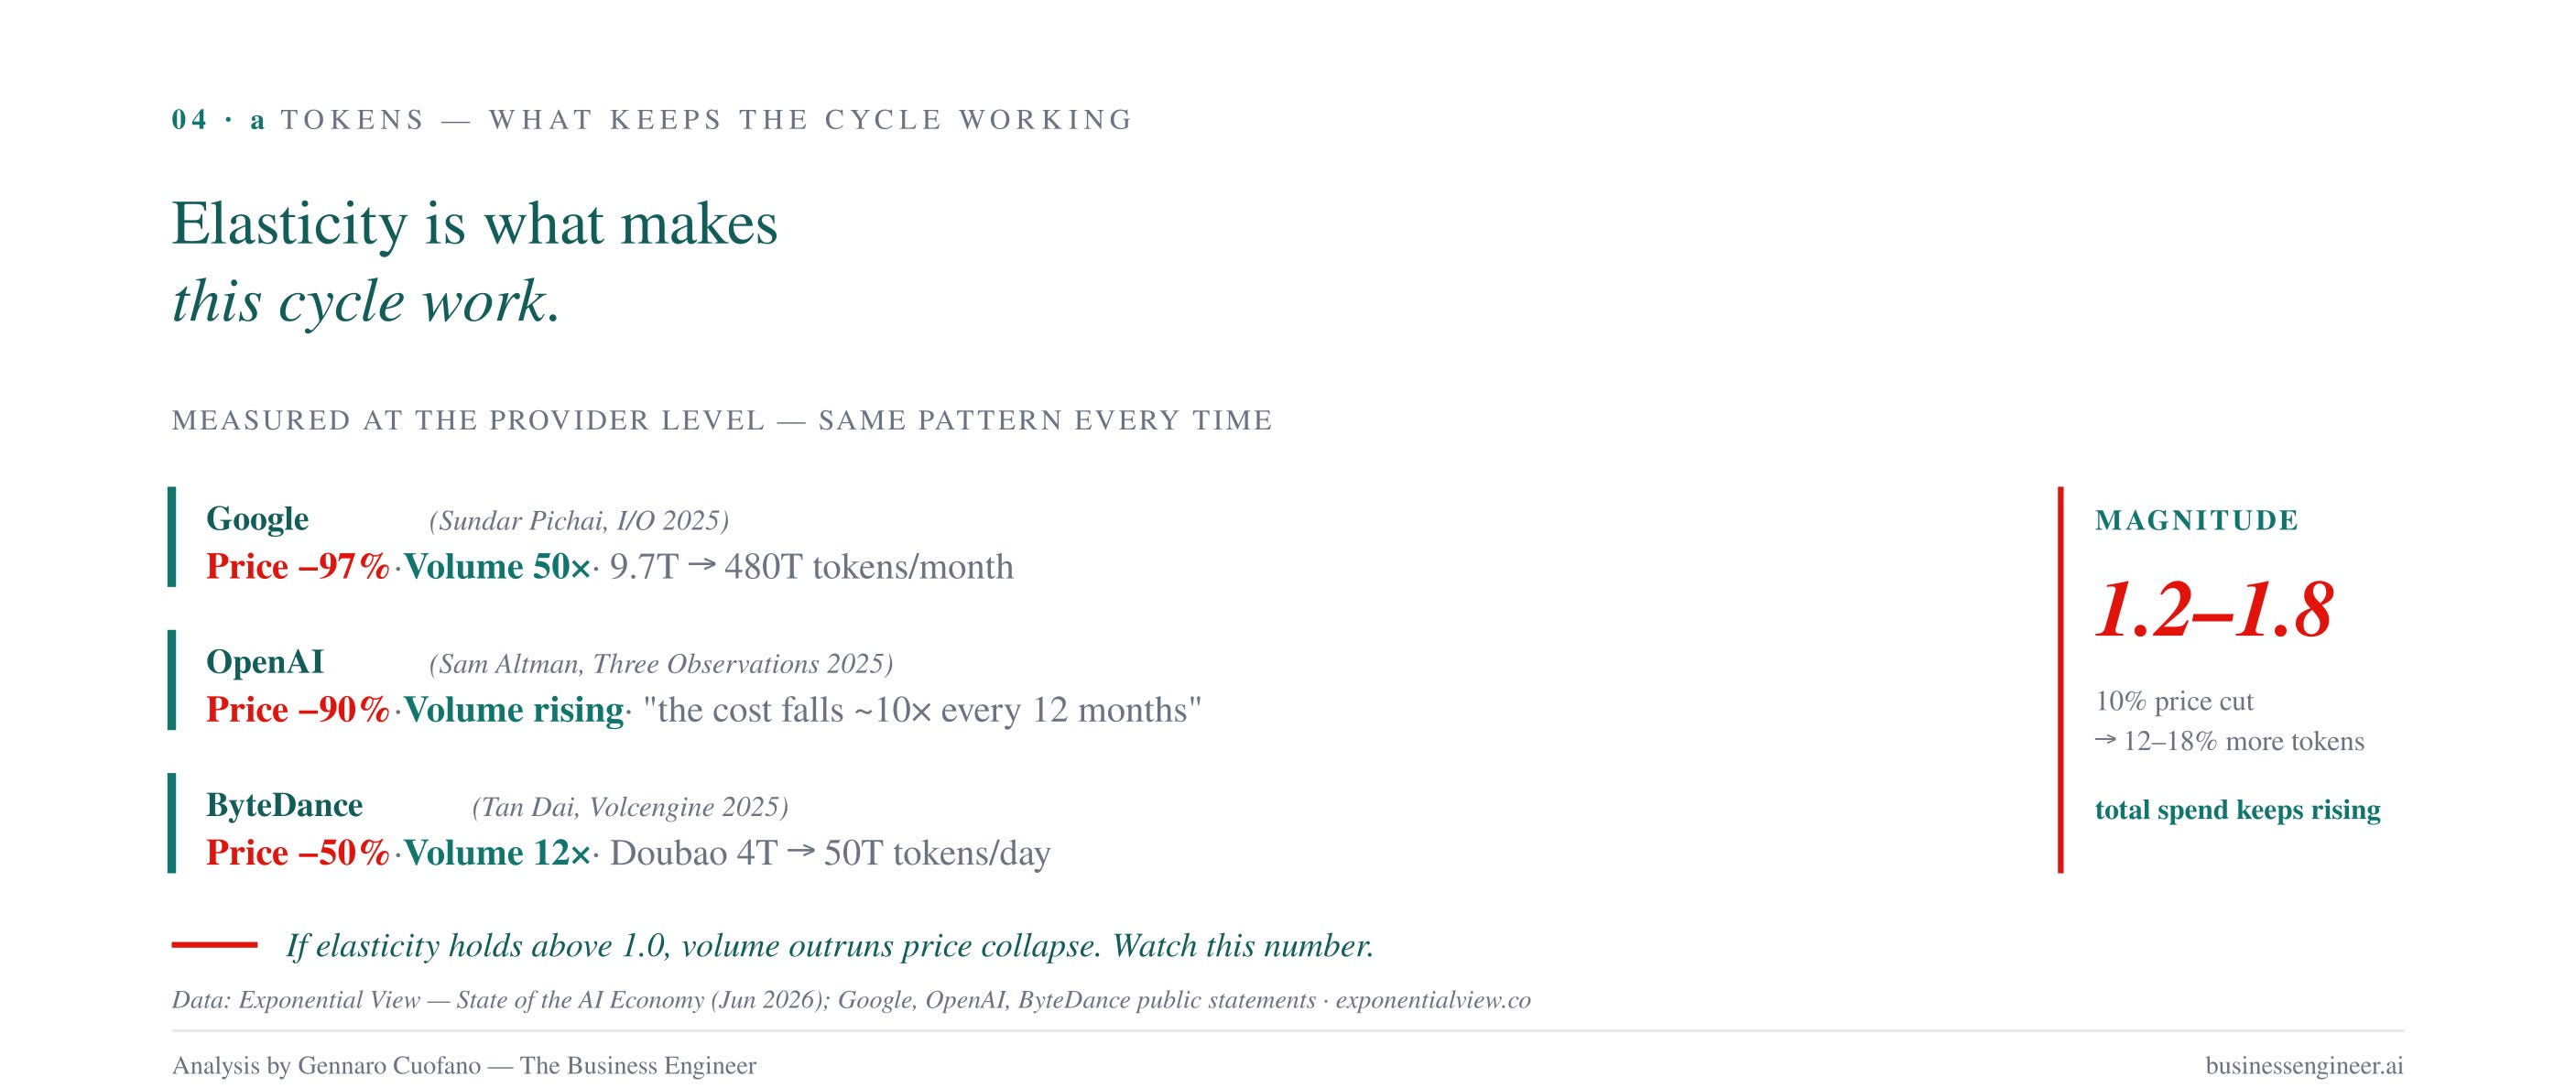
Every 10% price cut generates 12–18% more tokens. This is measured price elasticity of 1.2 to 1.8 — well above 1.0, which means total token spend keeps rising even as prices collapse. Sundar Pichai’s I/O 2025 quote nails it: Google’s monthly token processing went from 9.7T to 480T tokens — a 50x rise against a 97% price decline. Similar patterns hold at ByteDance and OpenAI.
The elasticity is the mechanism that lets the industry serve a compounding depreciation stack with collapsing unit prices. Volume compounds faster than price falls. So far.
The chat-to-agent transition is a token amplifier
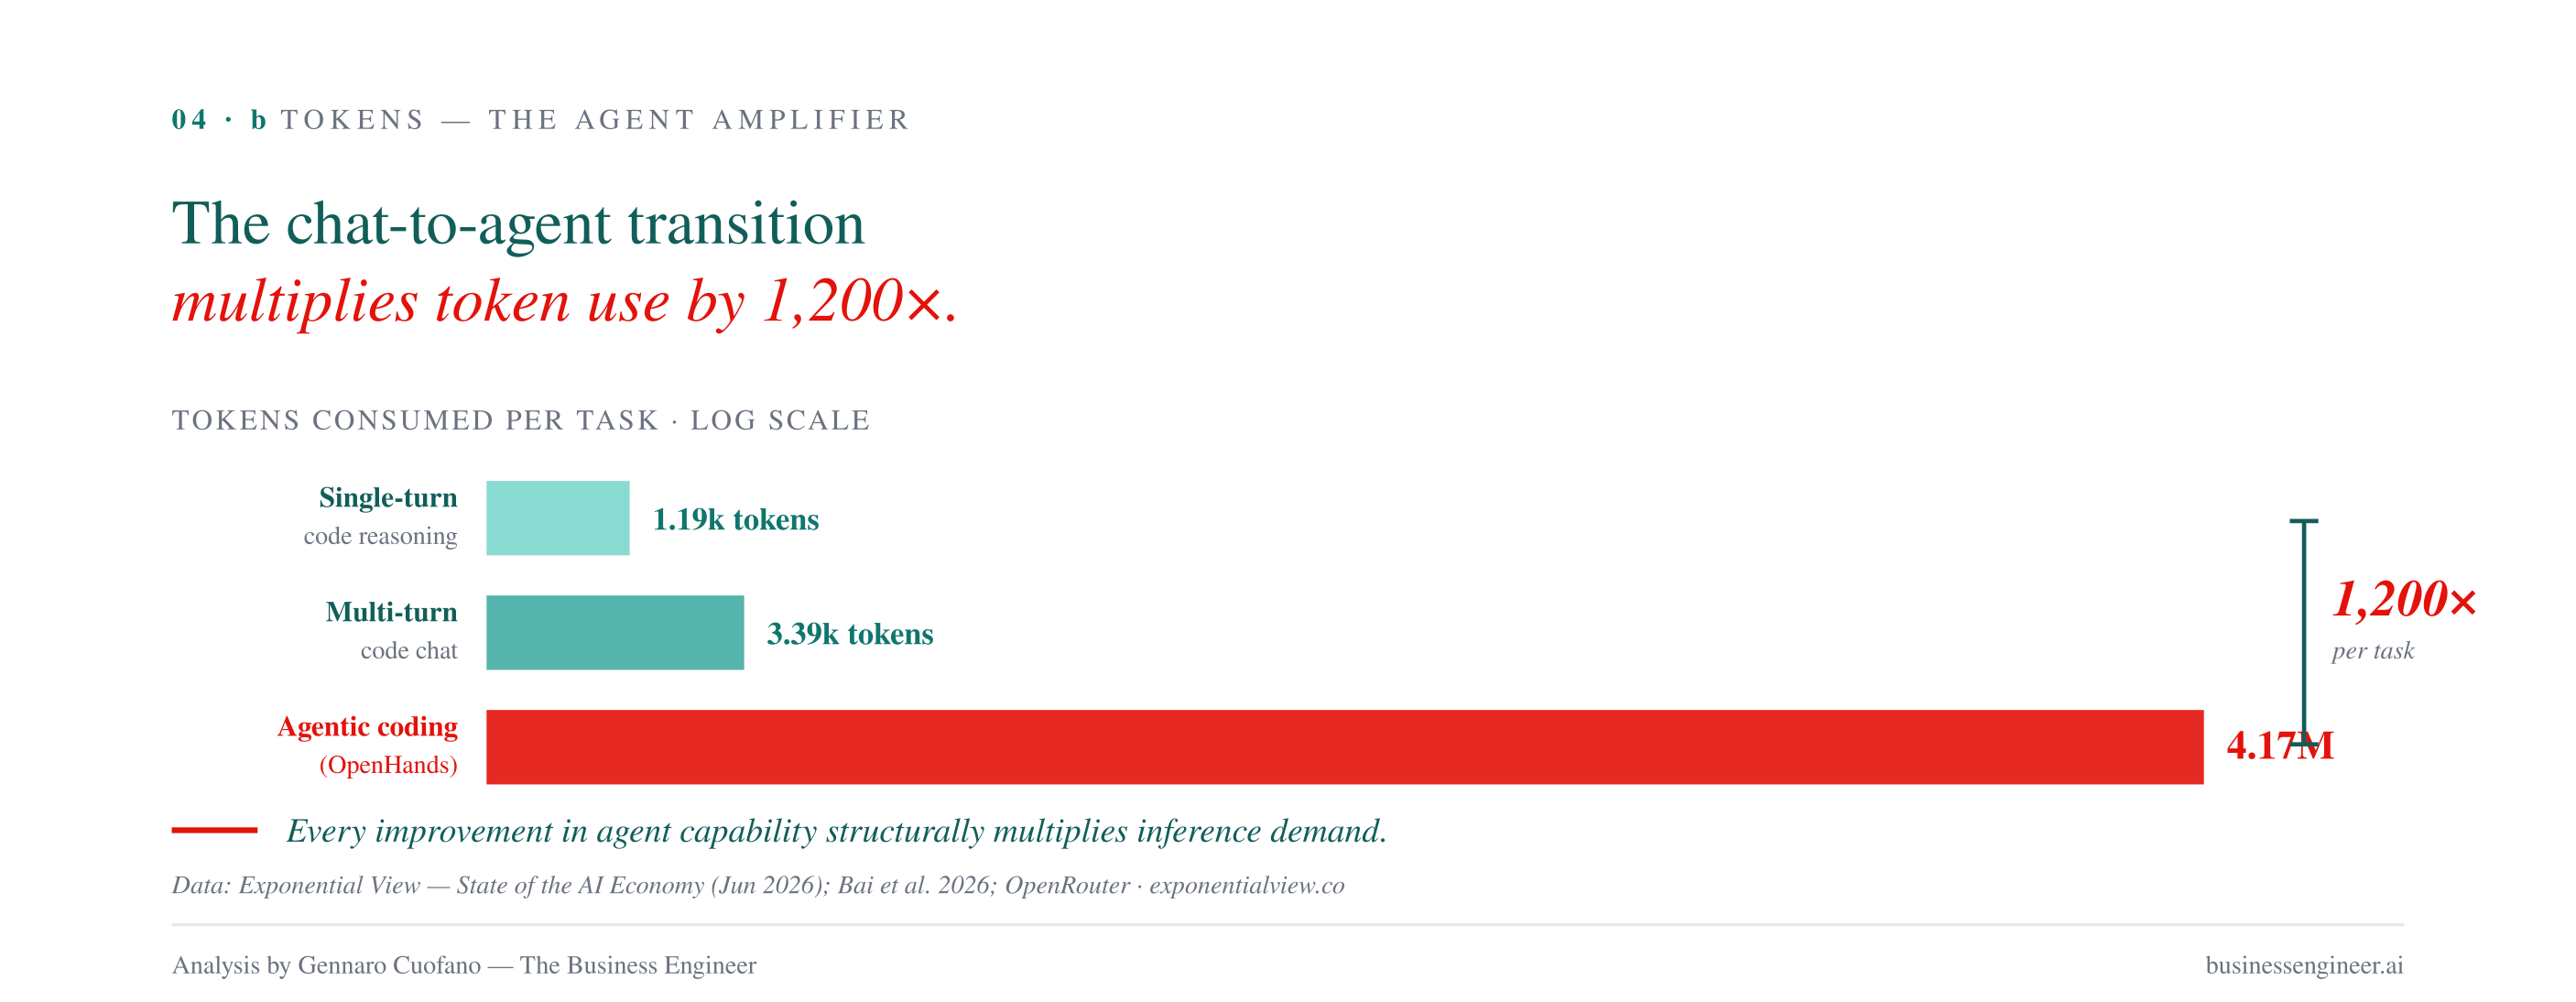
A single-turn code reasoning task consumes ~1,190 tokens. A multi-turn code chat consumes ~3,390 tokens. An agentic coding task using OpenHands consumes ~4.17 million tokens — roughly 1,200x more than the chat equivalent. As users shift from chat to agents, per-user token consumption isn’t rising linearly. It’s rising by three orders of magnitude.
That is why agent coordination density (measured as % of prompts that result in a tool call) has tripled since January 2026, from ~5% to ~15% on OpenRouter. Every meaningful improvement in agent capability structurally multiplies inference demand.
Quality-adjusted output tokens: the metric to internalize
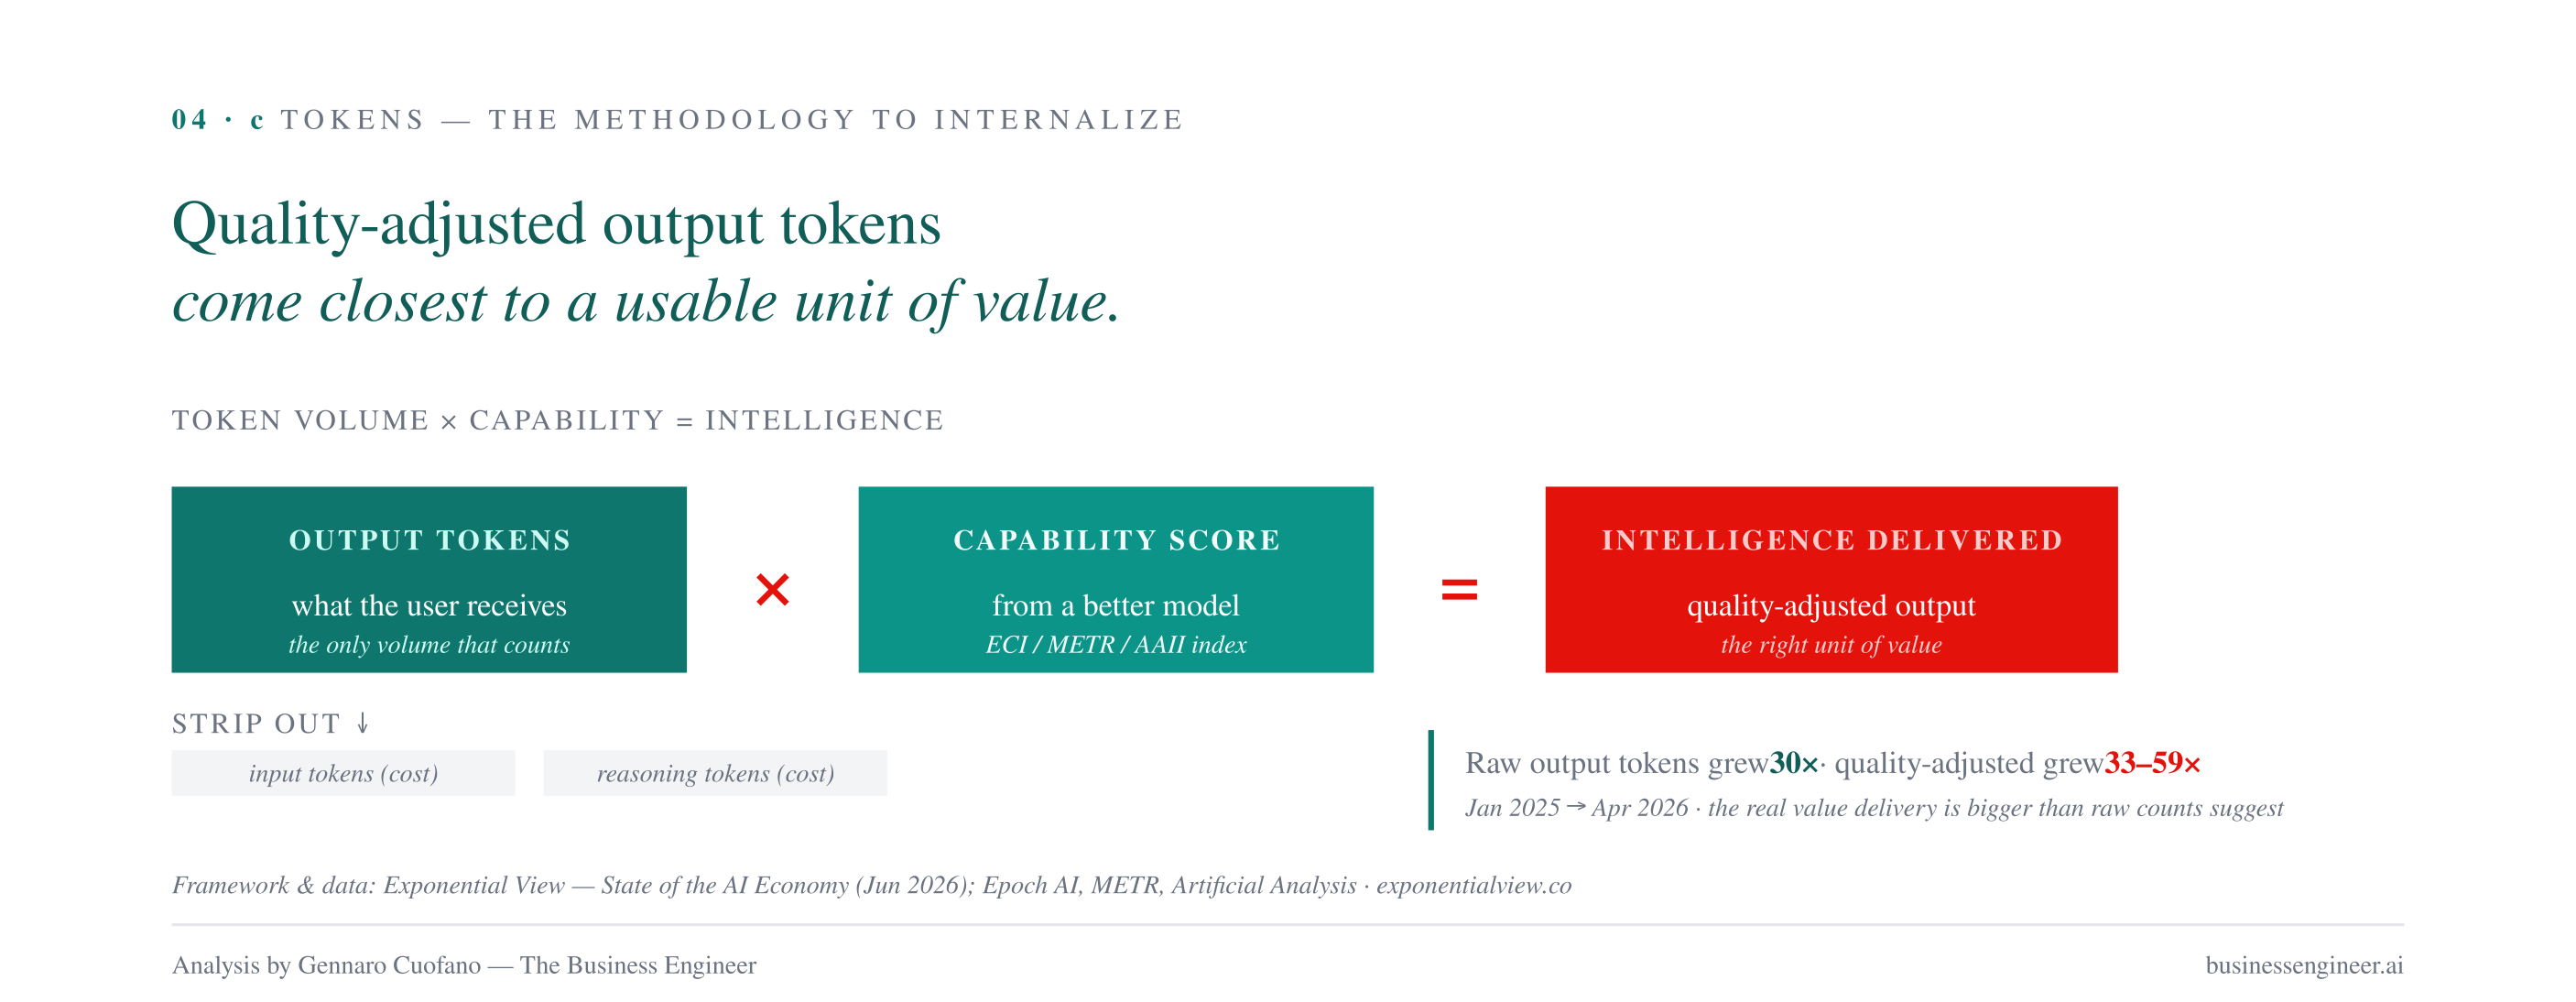
This is the methodological contribution from the Exponential View team that I think will become standard.
Raw token counts are deceptive. You can burn arbitrary reasoning tokens to marginally improve output quality. What the user actually receives is only the output tokens, not the input or the reasoning tokens. And output from a better model is worth more per token.
So: quality-adjusted output tokens = output tokens × model capability score.
Between January 2025 and April 2026, raw total tokens grew ~39x. Raw output tokens grew only ~30x (because more of the growth was in input and reasoning). But quality-adjusted output tokens grew 33x to 59x depending on which capability index you use (Epoch, METR, or Artificial Analysis).
The gap between raw and quality-adjusted growth tells you something about where the actual value is being created. It also solves the “how do we measure output when reasoning tokens inflate the counts?” problem in a clean way.
Data-center-scale monetization is climbing
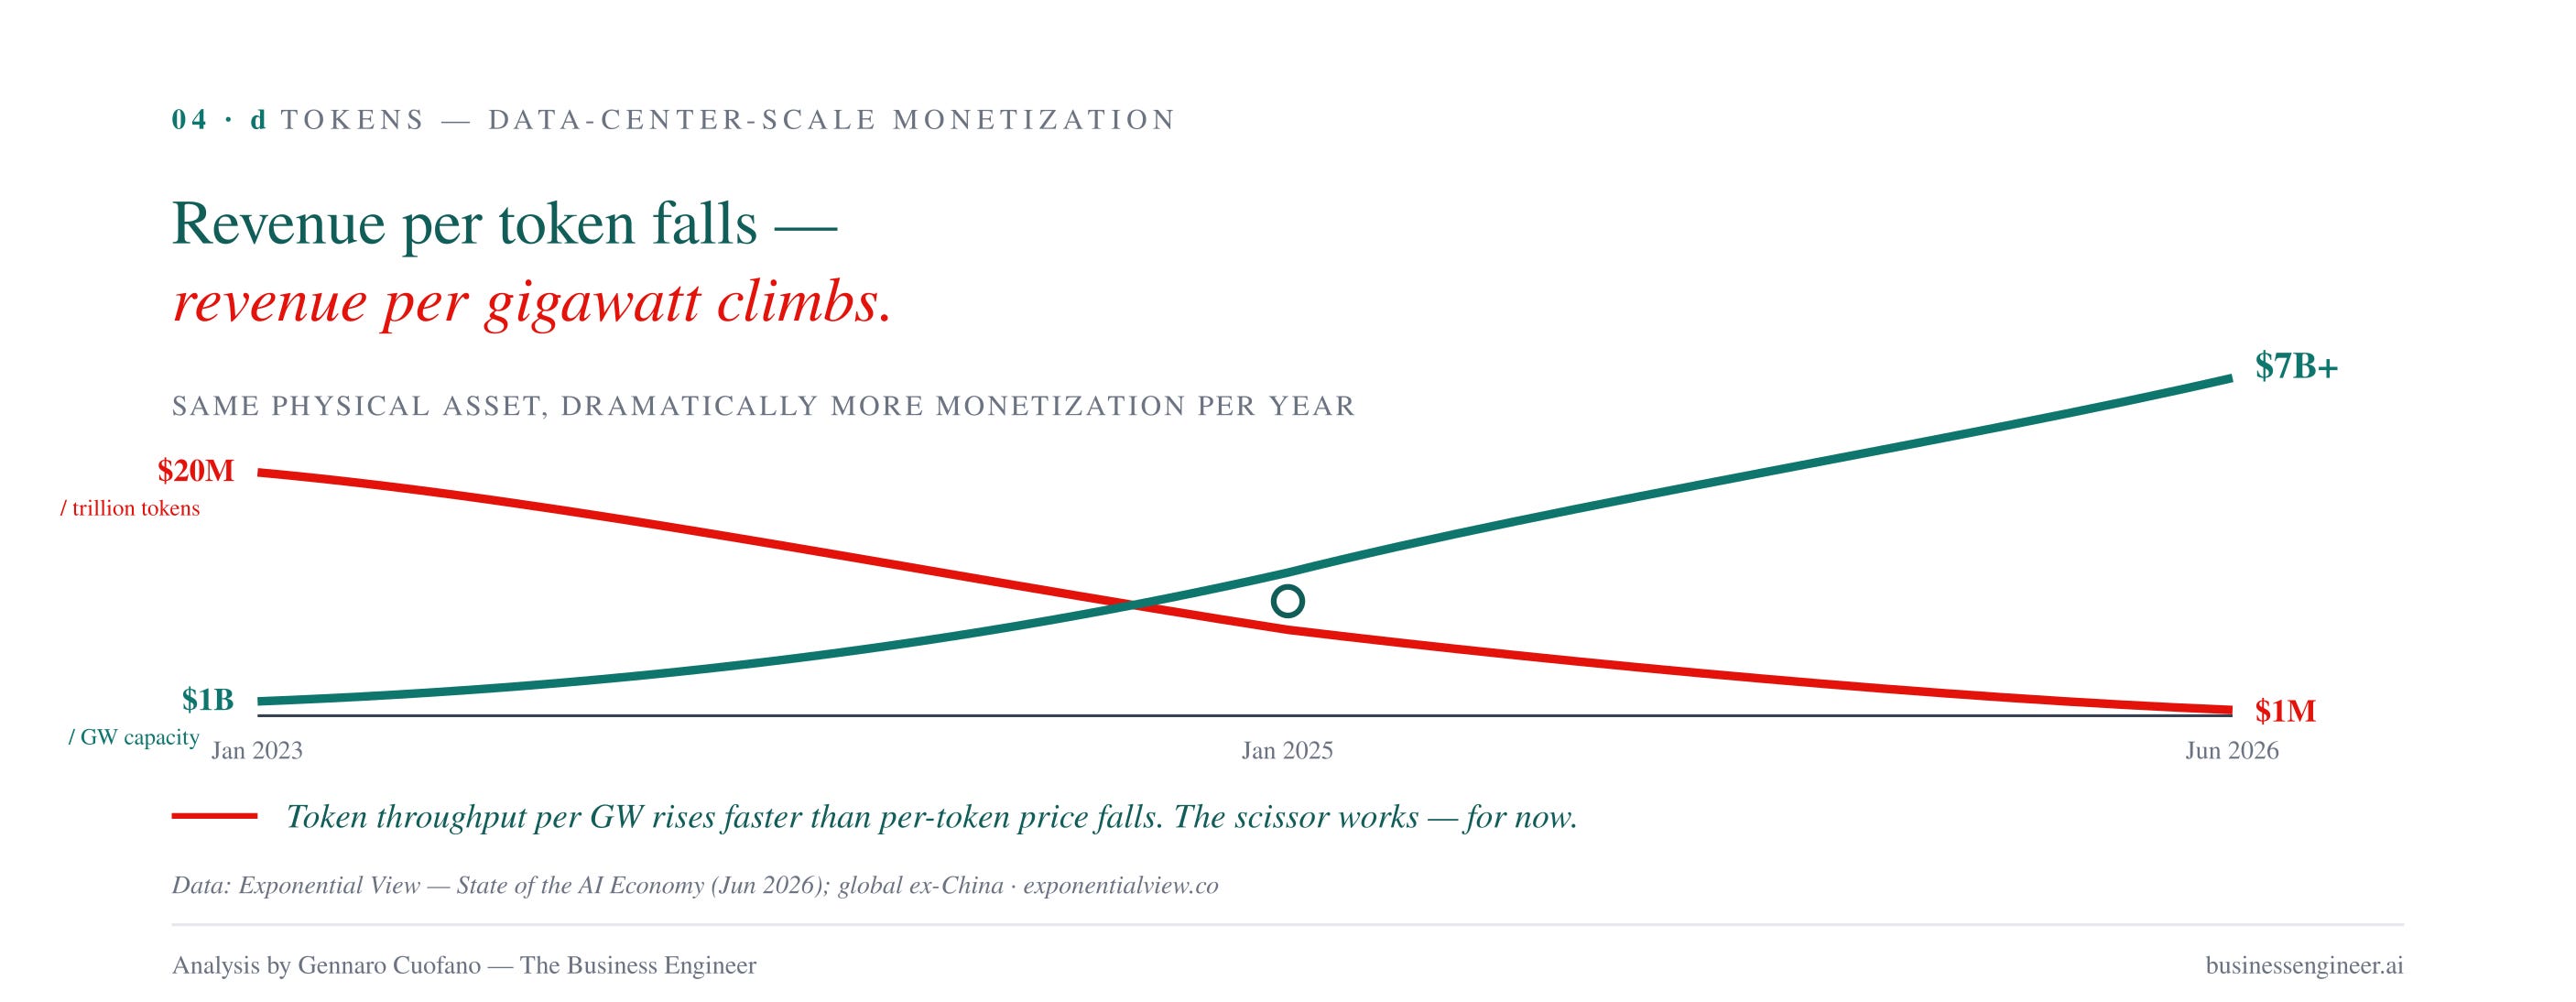
There’s a fascinating scissor chart deep in the tokens section. Revenue per trillion tokens has fallen since its 2023 peak, mirroring the price decline. But revenue per gigawatt of data center capacity has climbed past $7B/GW — because the token throughput per GW has grown far faster than the per-token price has fallen. Same physical asset, dramatically more monetization per unit of capacity per year.
The Compression: Cheaper tokens plus better models plus agentic workflows equals an inference demand curve that outruns the price collapse. The economics work as long as the elasticity holds.
Stack: Where the Value Is Captured — and Where It’s Moving
Follow me on The AI Supercycle as well!
This is the section that anyone building or investing in AI needs to read carefully.
Today, revenue is concentrated: NVIDIA alone captures a run-rate ~$300B in Q1 2026, dwarfing every other player in the stack. TSMC is at ~$90B. The hyperscalers, model labs, and app layer combined are still a fraction of the chip layer.
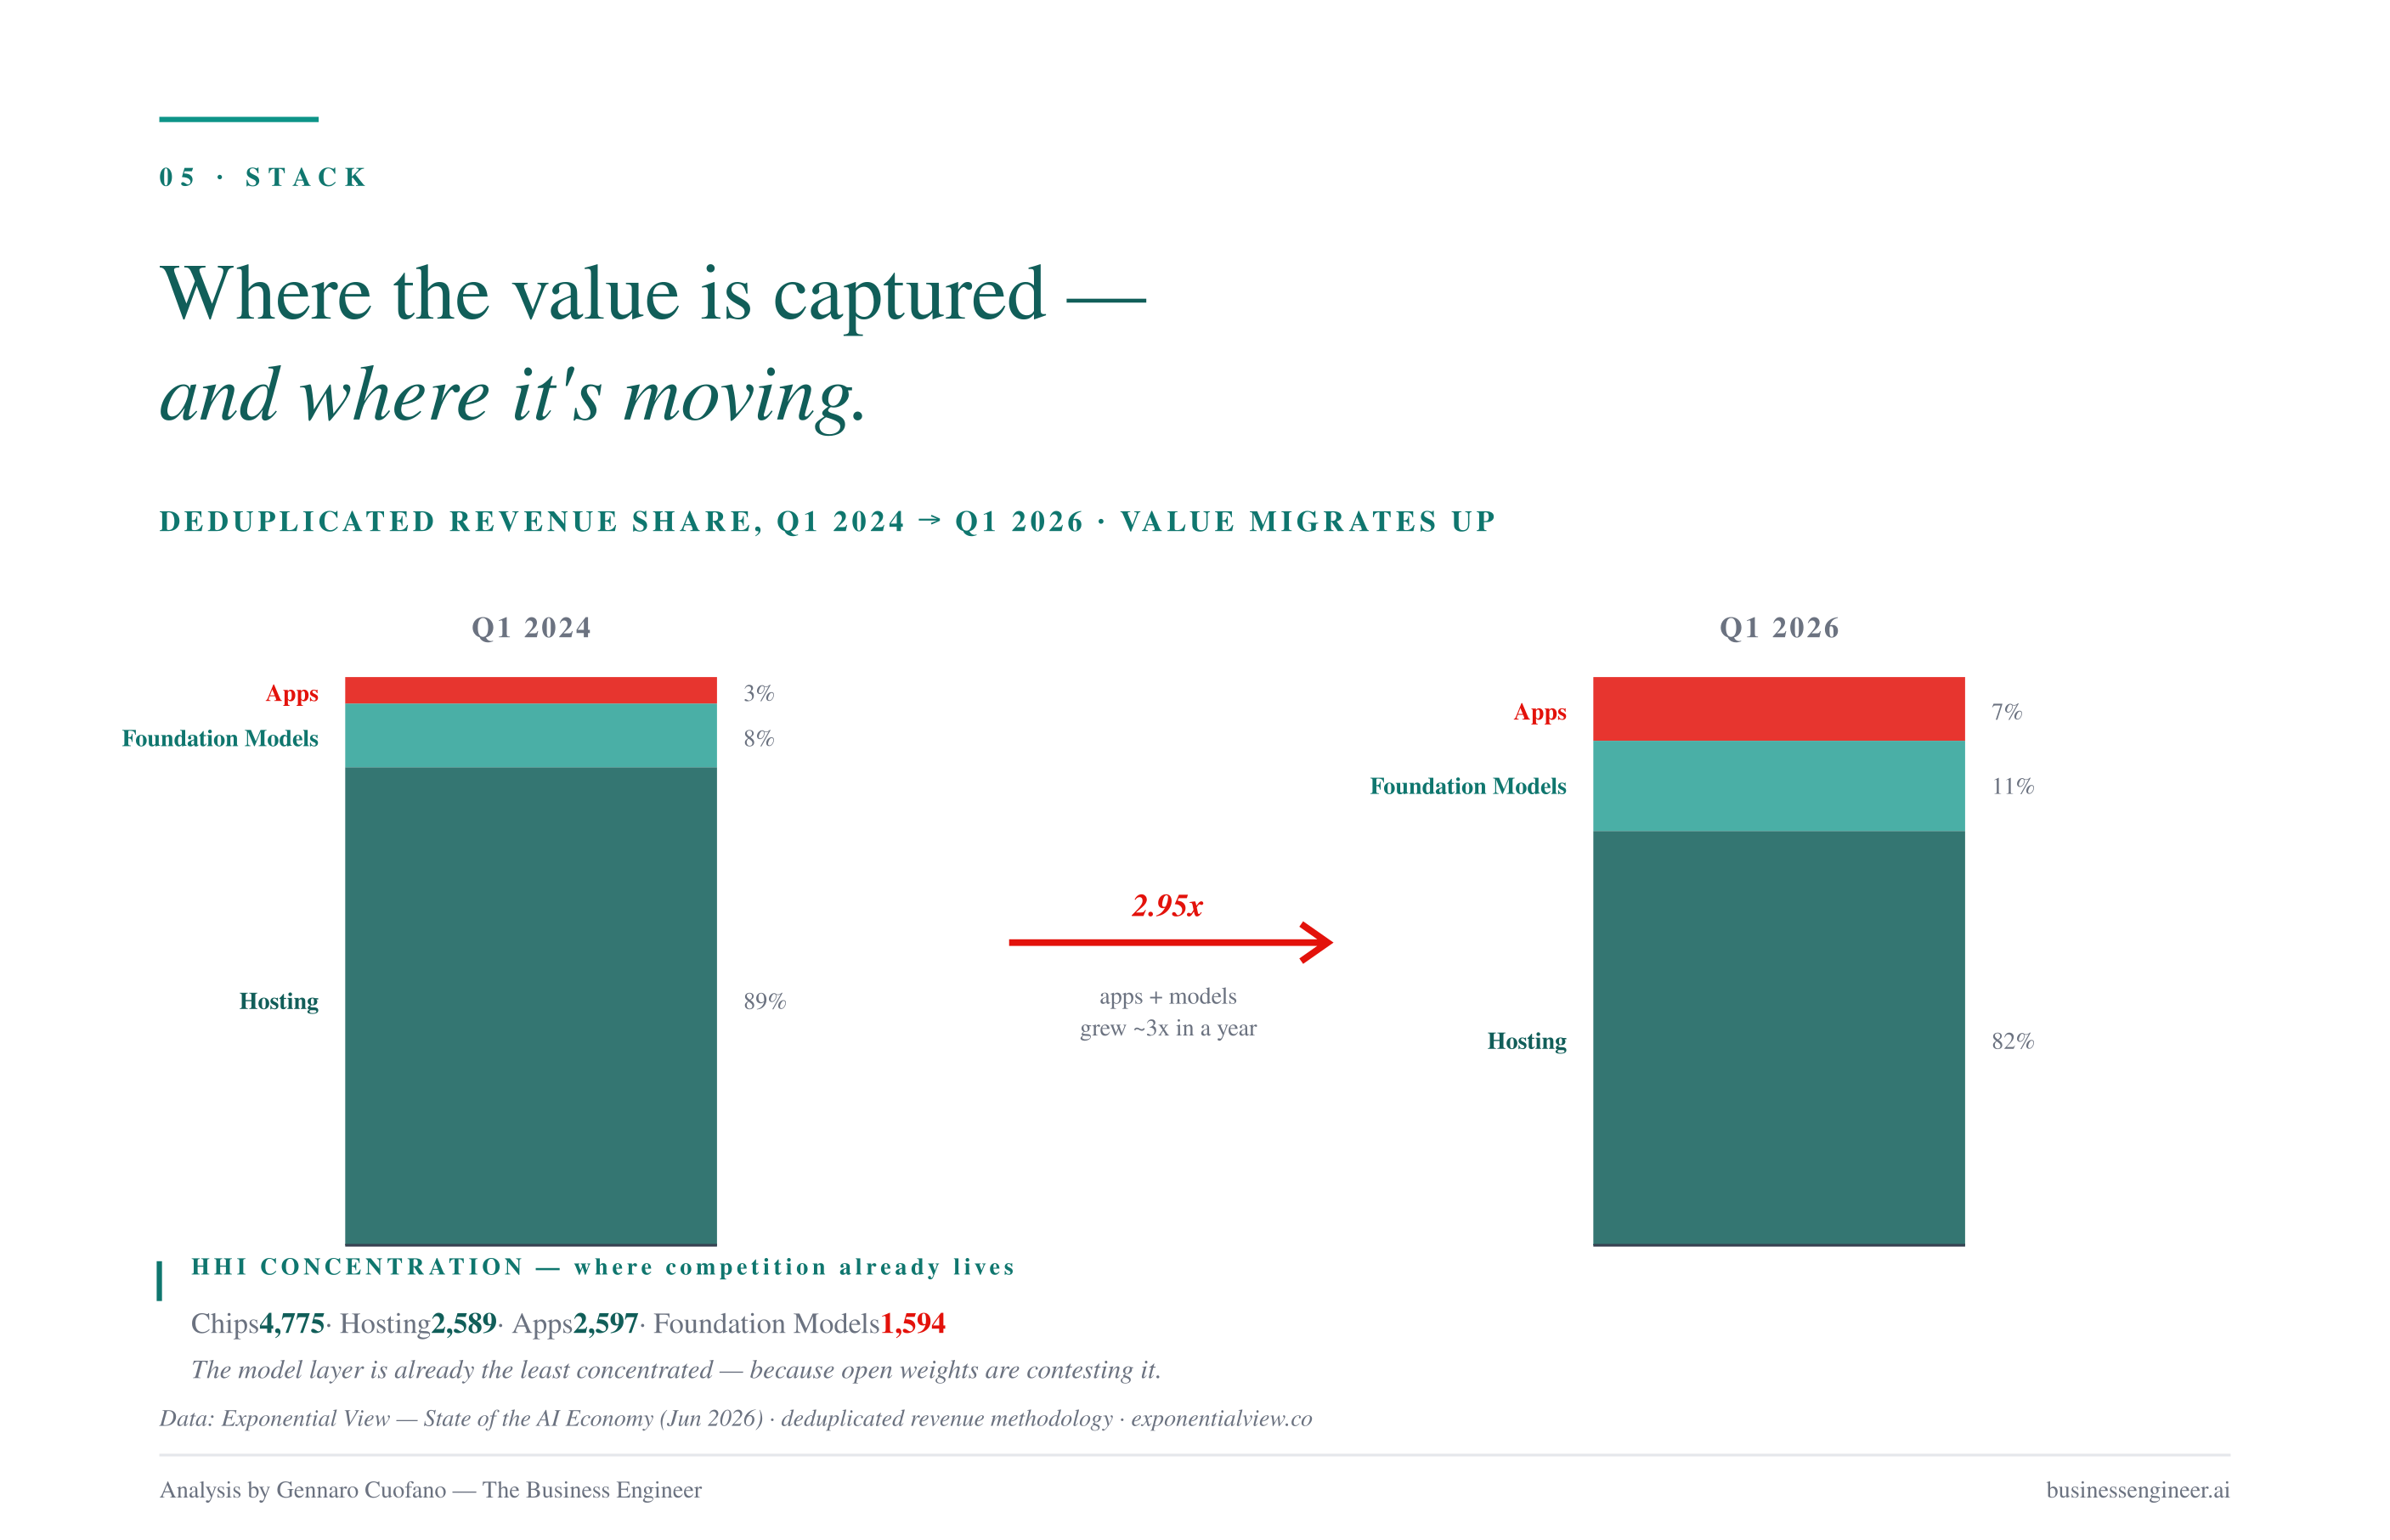
But the deduplicated share is moving. Between Q1 2024 and Q1 2026:
Hosting layer: 89% → 82%
Foundation model layer: 8% → 11%
App layer: 3% → 7%
Deduplicated app + model revenue is growing at 2.95x per year — nearly 3x annually. Value is migrating up the stack, exactly as every prior tech wave eventually did.
Pricing power follows competition, not stack position
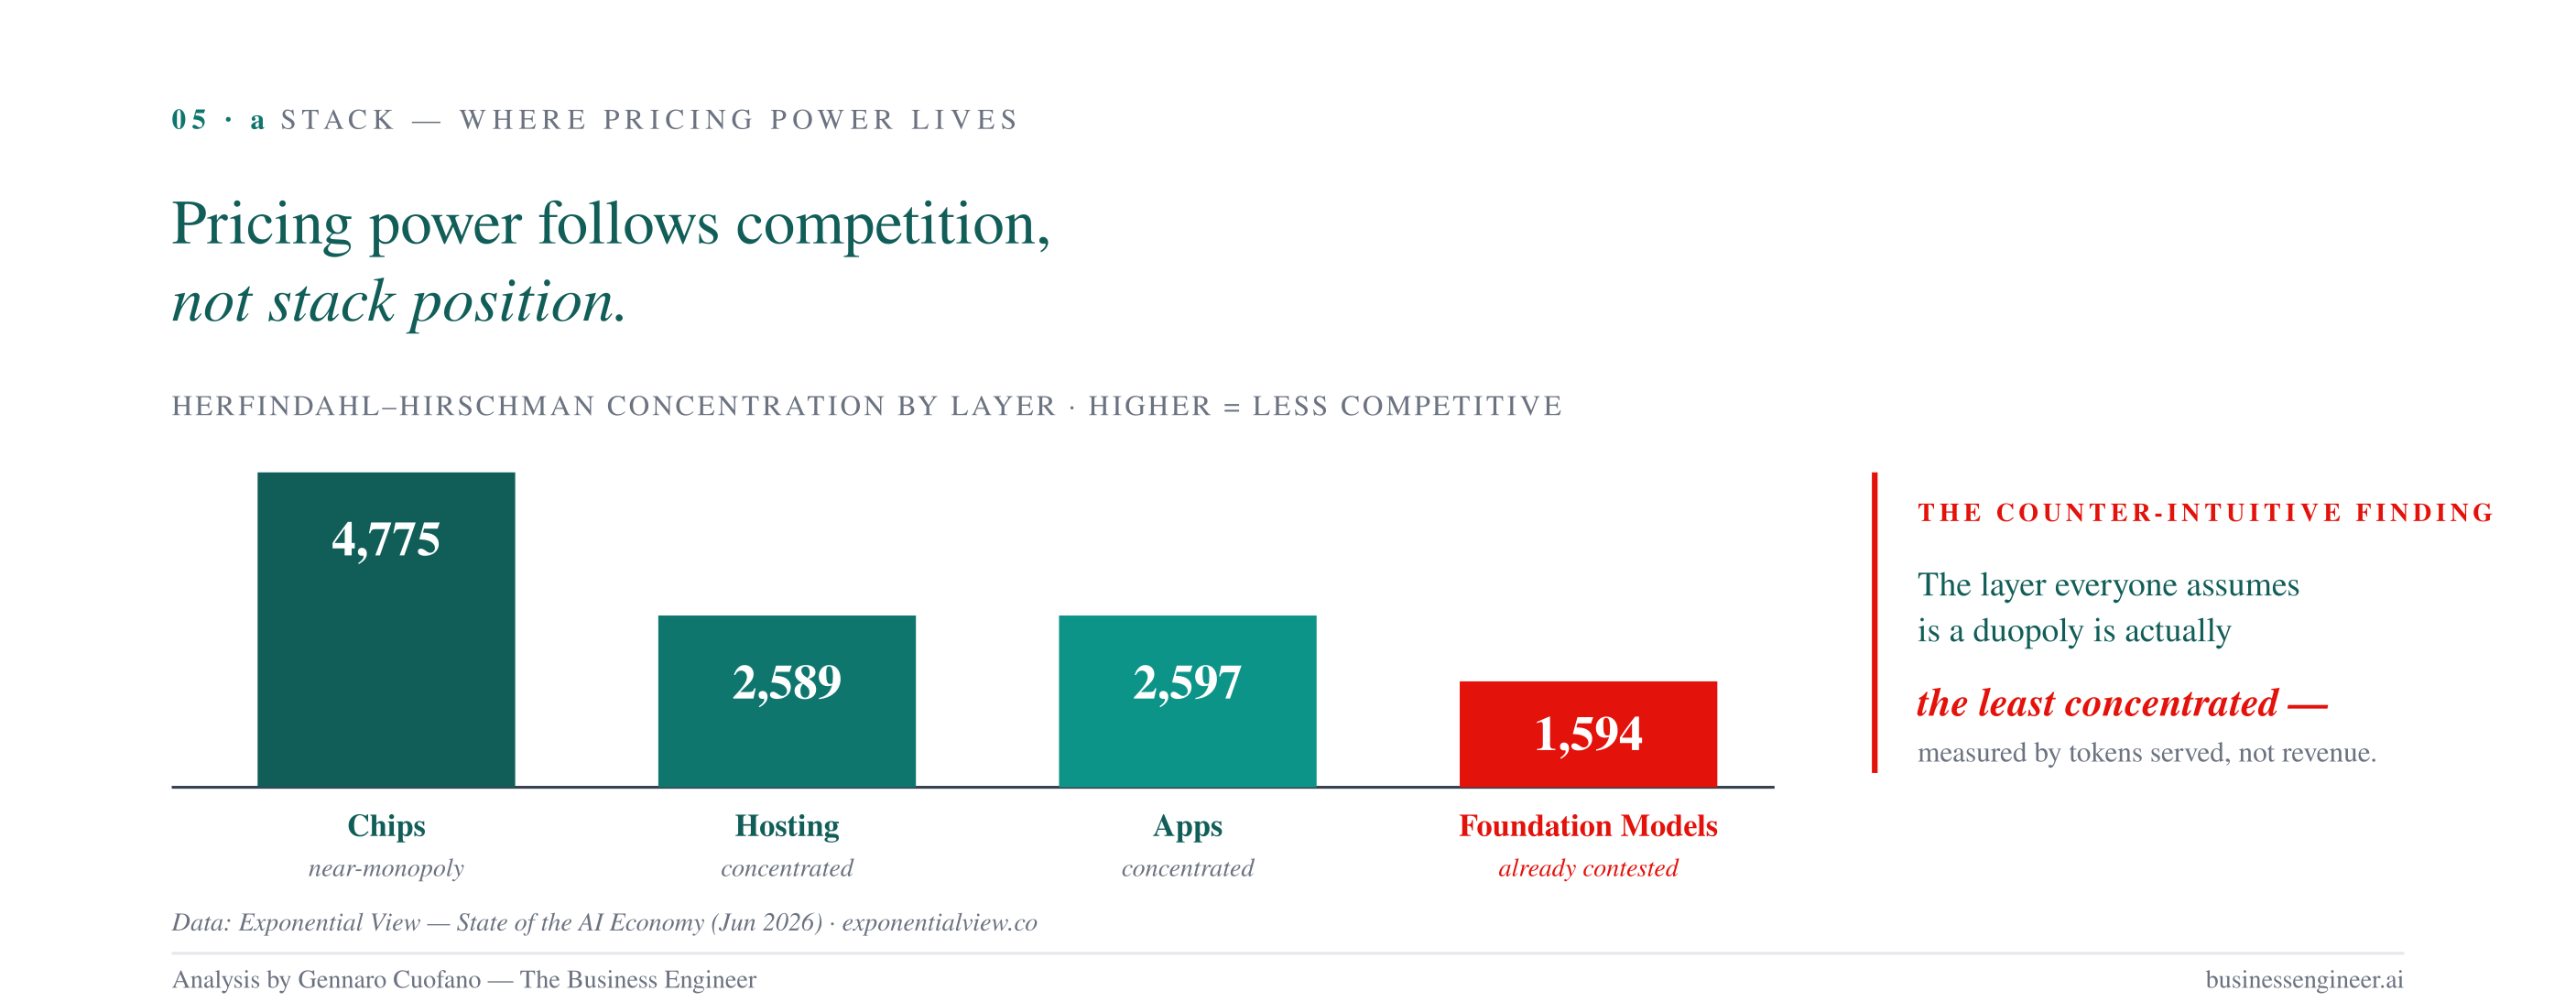
The Herfindahl-Hirschman concentration analysis is the sharpest single insight in the whole report. Concentration by layer:
Chips: HHI 4,775 — highly concentrated (NVIDIA)
Hosting: HHI 2,589 — moderately concentrated
Apps: HHI 2,597 — moderately concentrated
Foundation Models: HHI 1,594 — least concentrated when you measure by token share, because of the open-weight competitors
That last bullet is crucial. Foundation model revenue is concentrated in OpenAI and Anthropic. But foundation model tokens served — the actual production workload — is far more contested because open-weight models (DeepSeek, Kimi, MiniMax, Qwen) are consuming a growing share of inference volume.
The frontier premium is real but time-limited
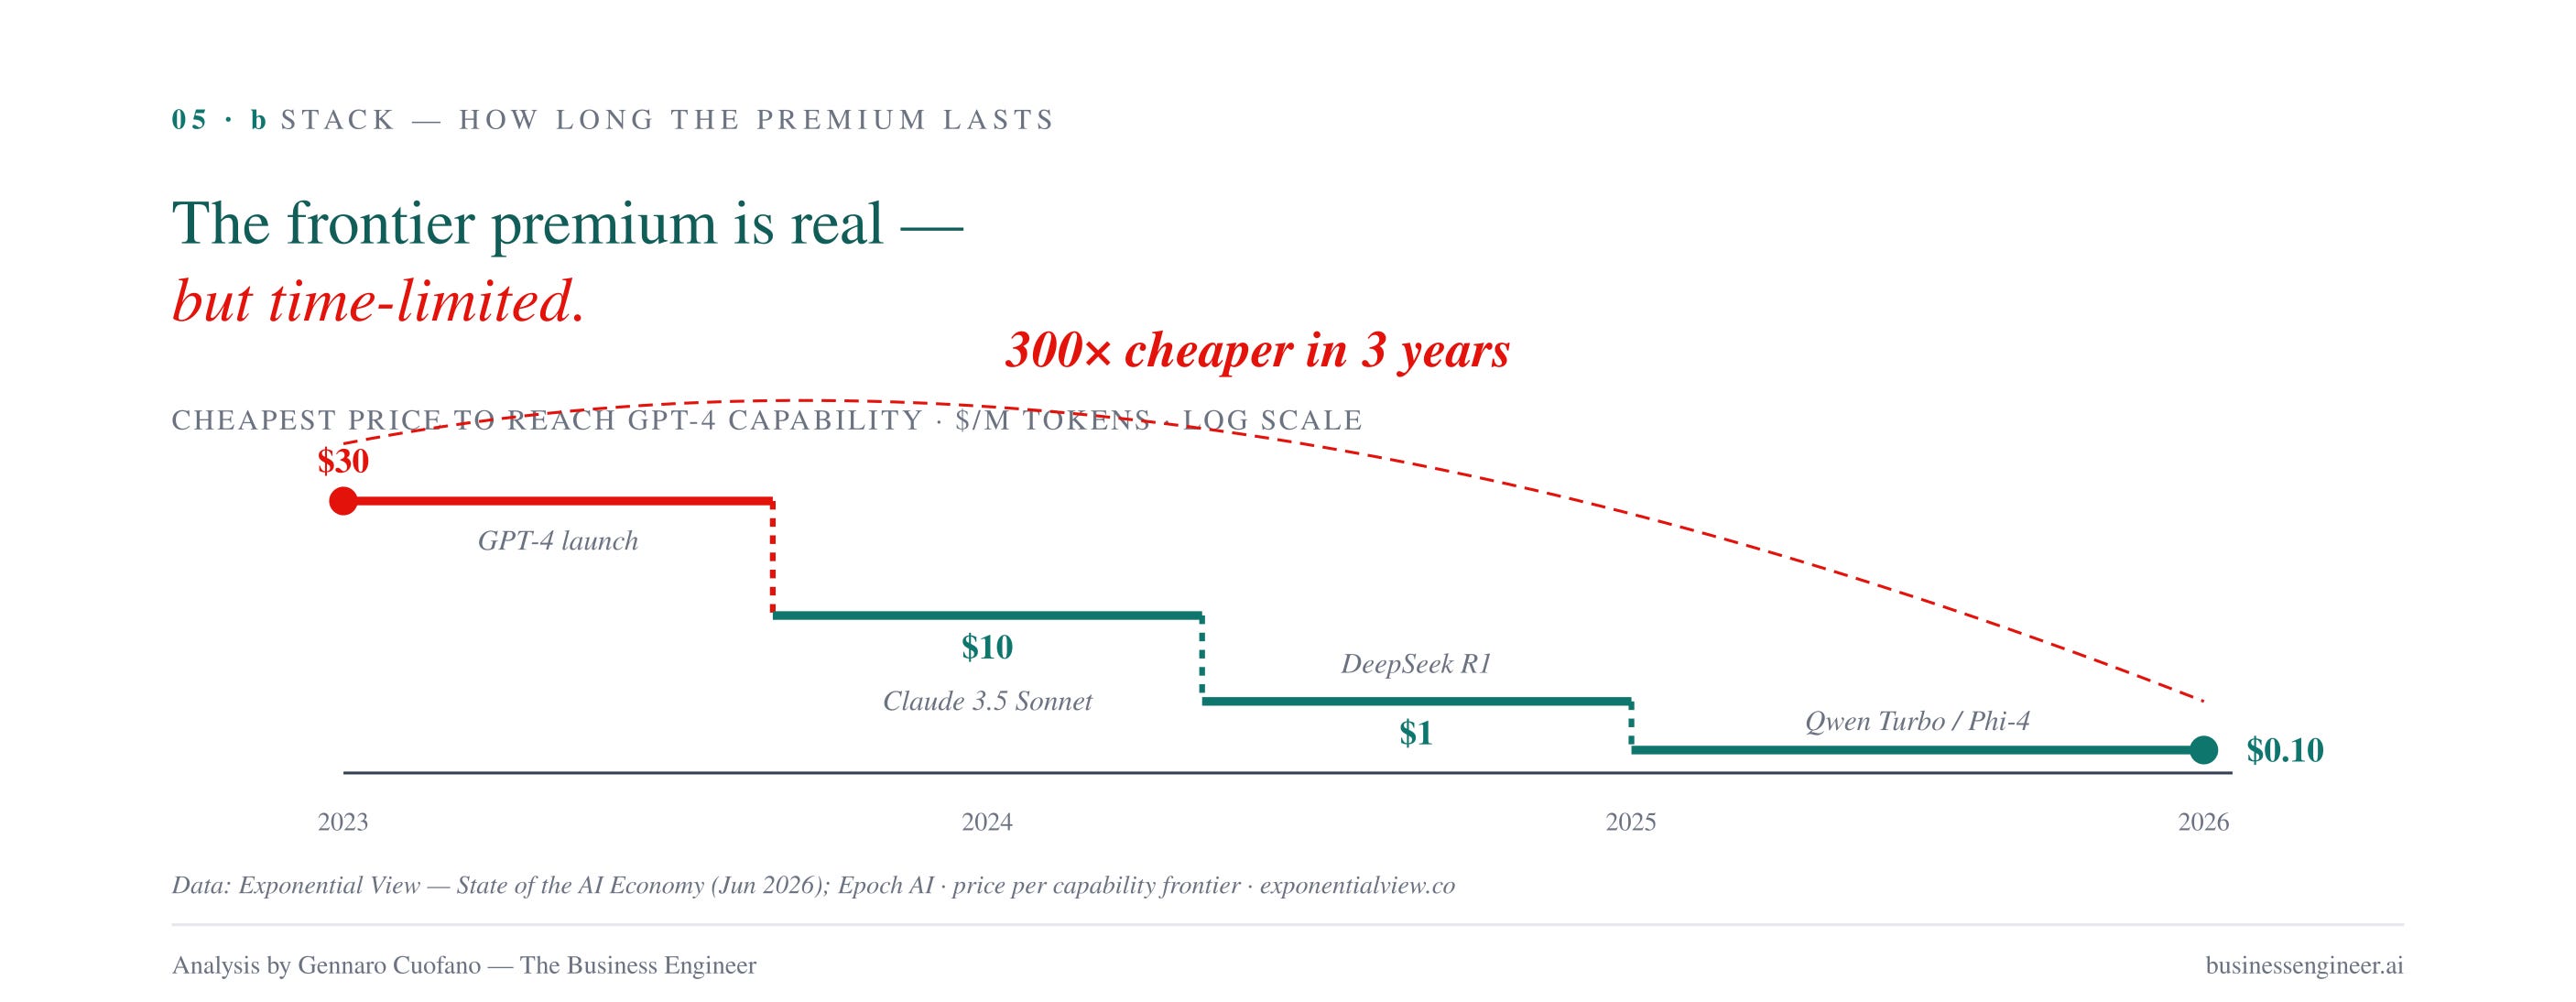
Frontier Labs can charge a premium for the current-quarter frontier. GPT-4.5 launched at $100/M tokens. Opus 4.1 at similar levels. But last year’s frontier commoditized fast. GPT-4-level capability that cost $30/M tokens in 2023 costs ~$0.10 today. Anthropic’s Opus 3 pricing at launch → GPT-5-nano pricing today: a ~300x price collapse for equivalent capability.
The line to watch: labs earn margin on the rate of frontier improvement, not on holding any static position. The moment the open-weight tier catches up to a given capability tier, the closed-weight premium at that tier collapses.
The OpenRouter signal — quiet but important
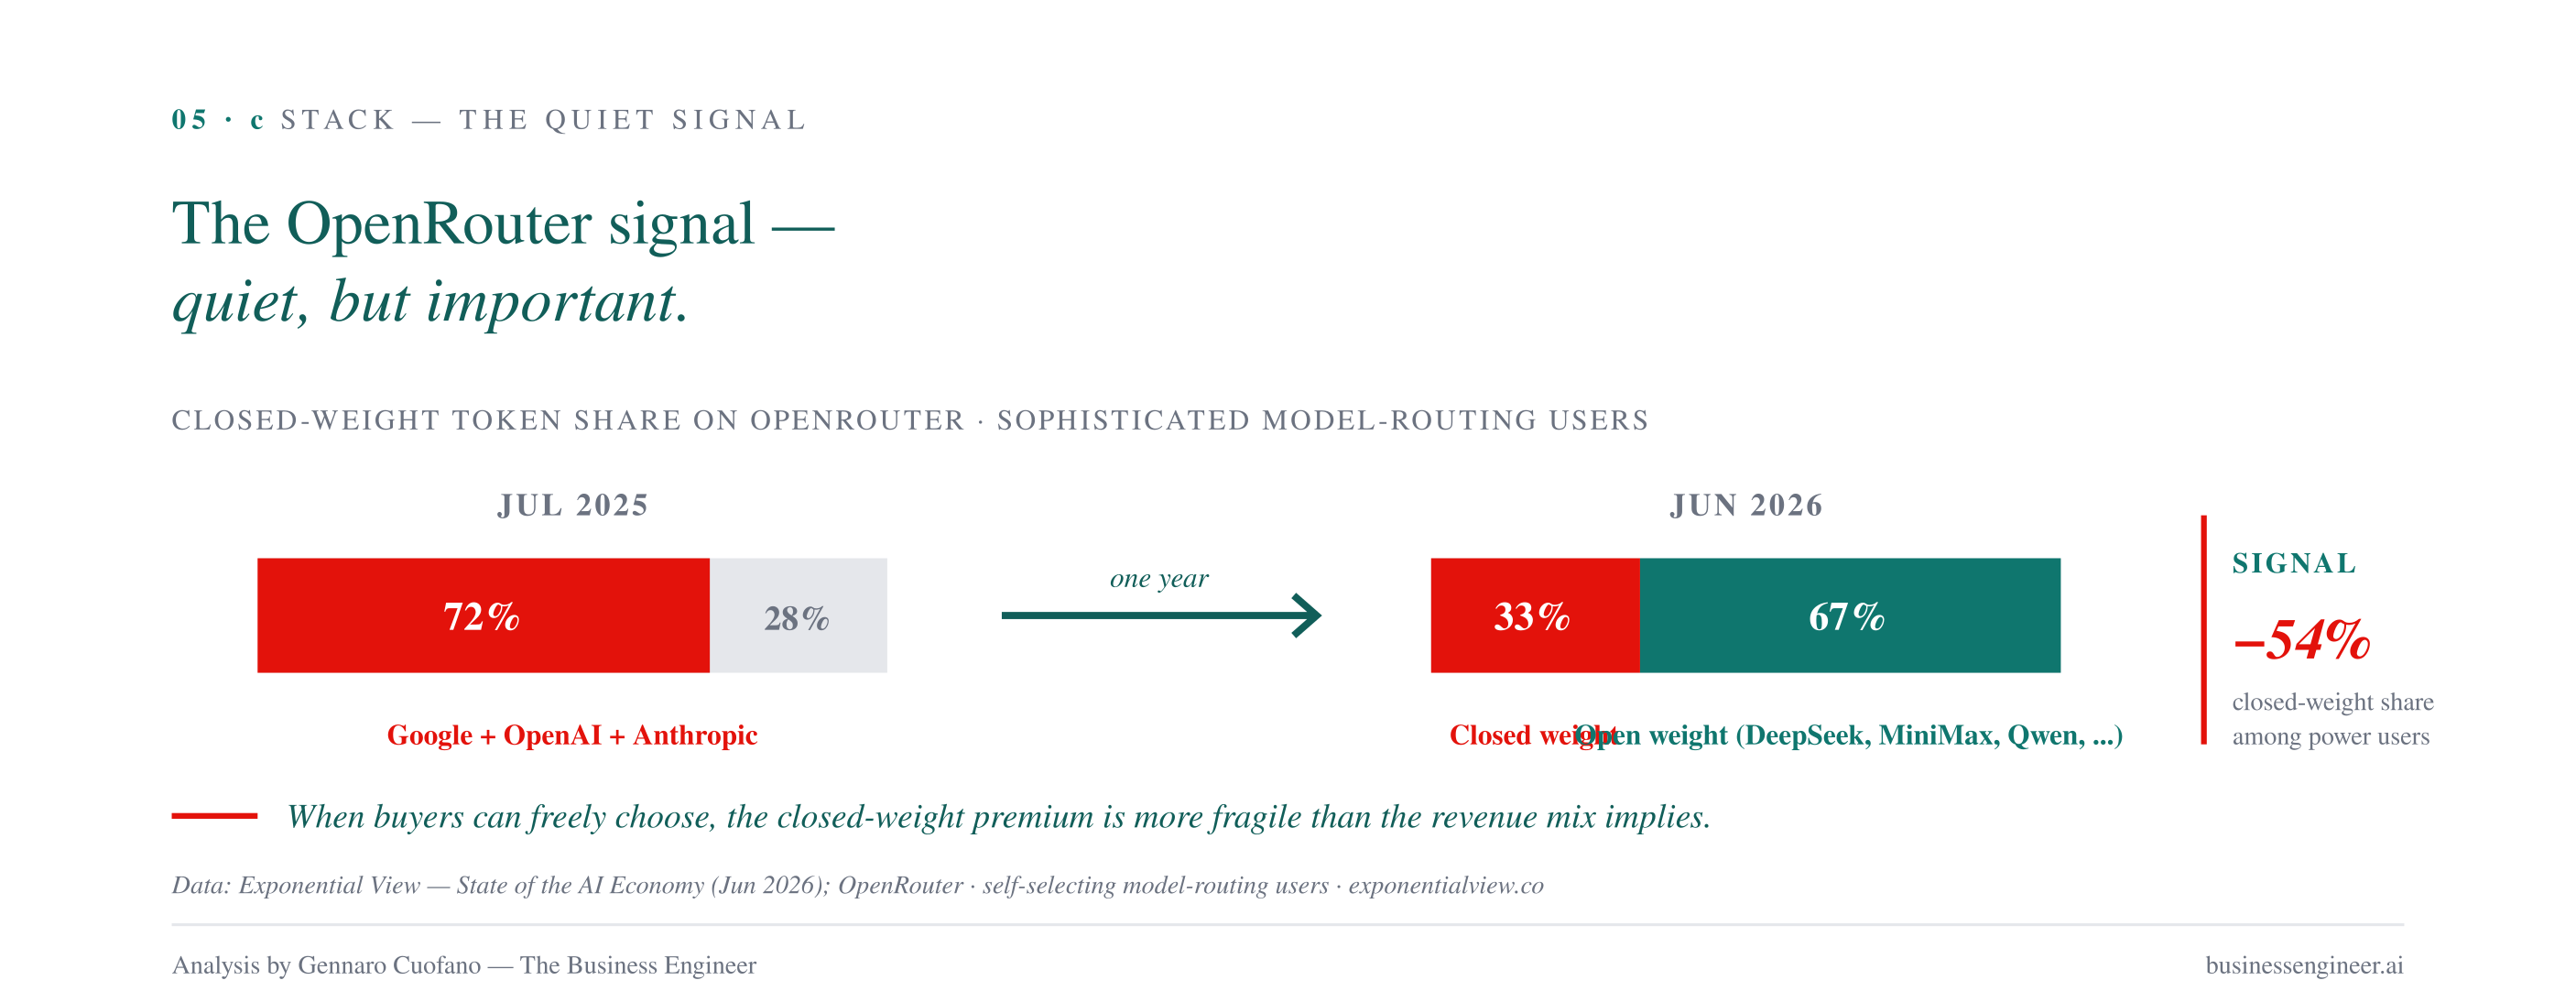
Among OpenRouter’s self-selecting “model-routing” users — the sophisticated buyers who explicitly choose which model to route each request to — Google + OpenAI + Anthropic’s combined token share fell from 72% to 33% over the last year. DeepSeek, MiniMax, Tencent, Xiaomi have picked up the difference.
This isn’t representative of the whole market. It is representative of what happens when a buyer is willing and able to compare across all model options. It suggests the closed-weight premium is more fragile than the revenue numbers alone imply.
Labs are responding — vertically
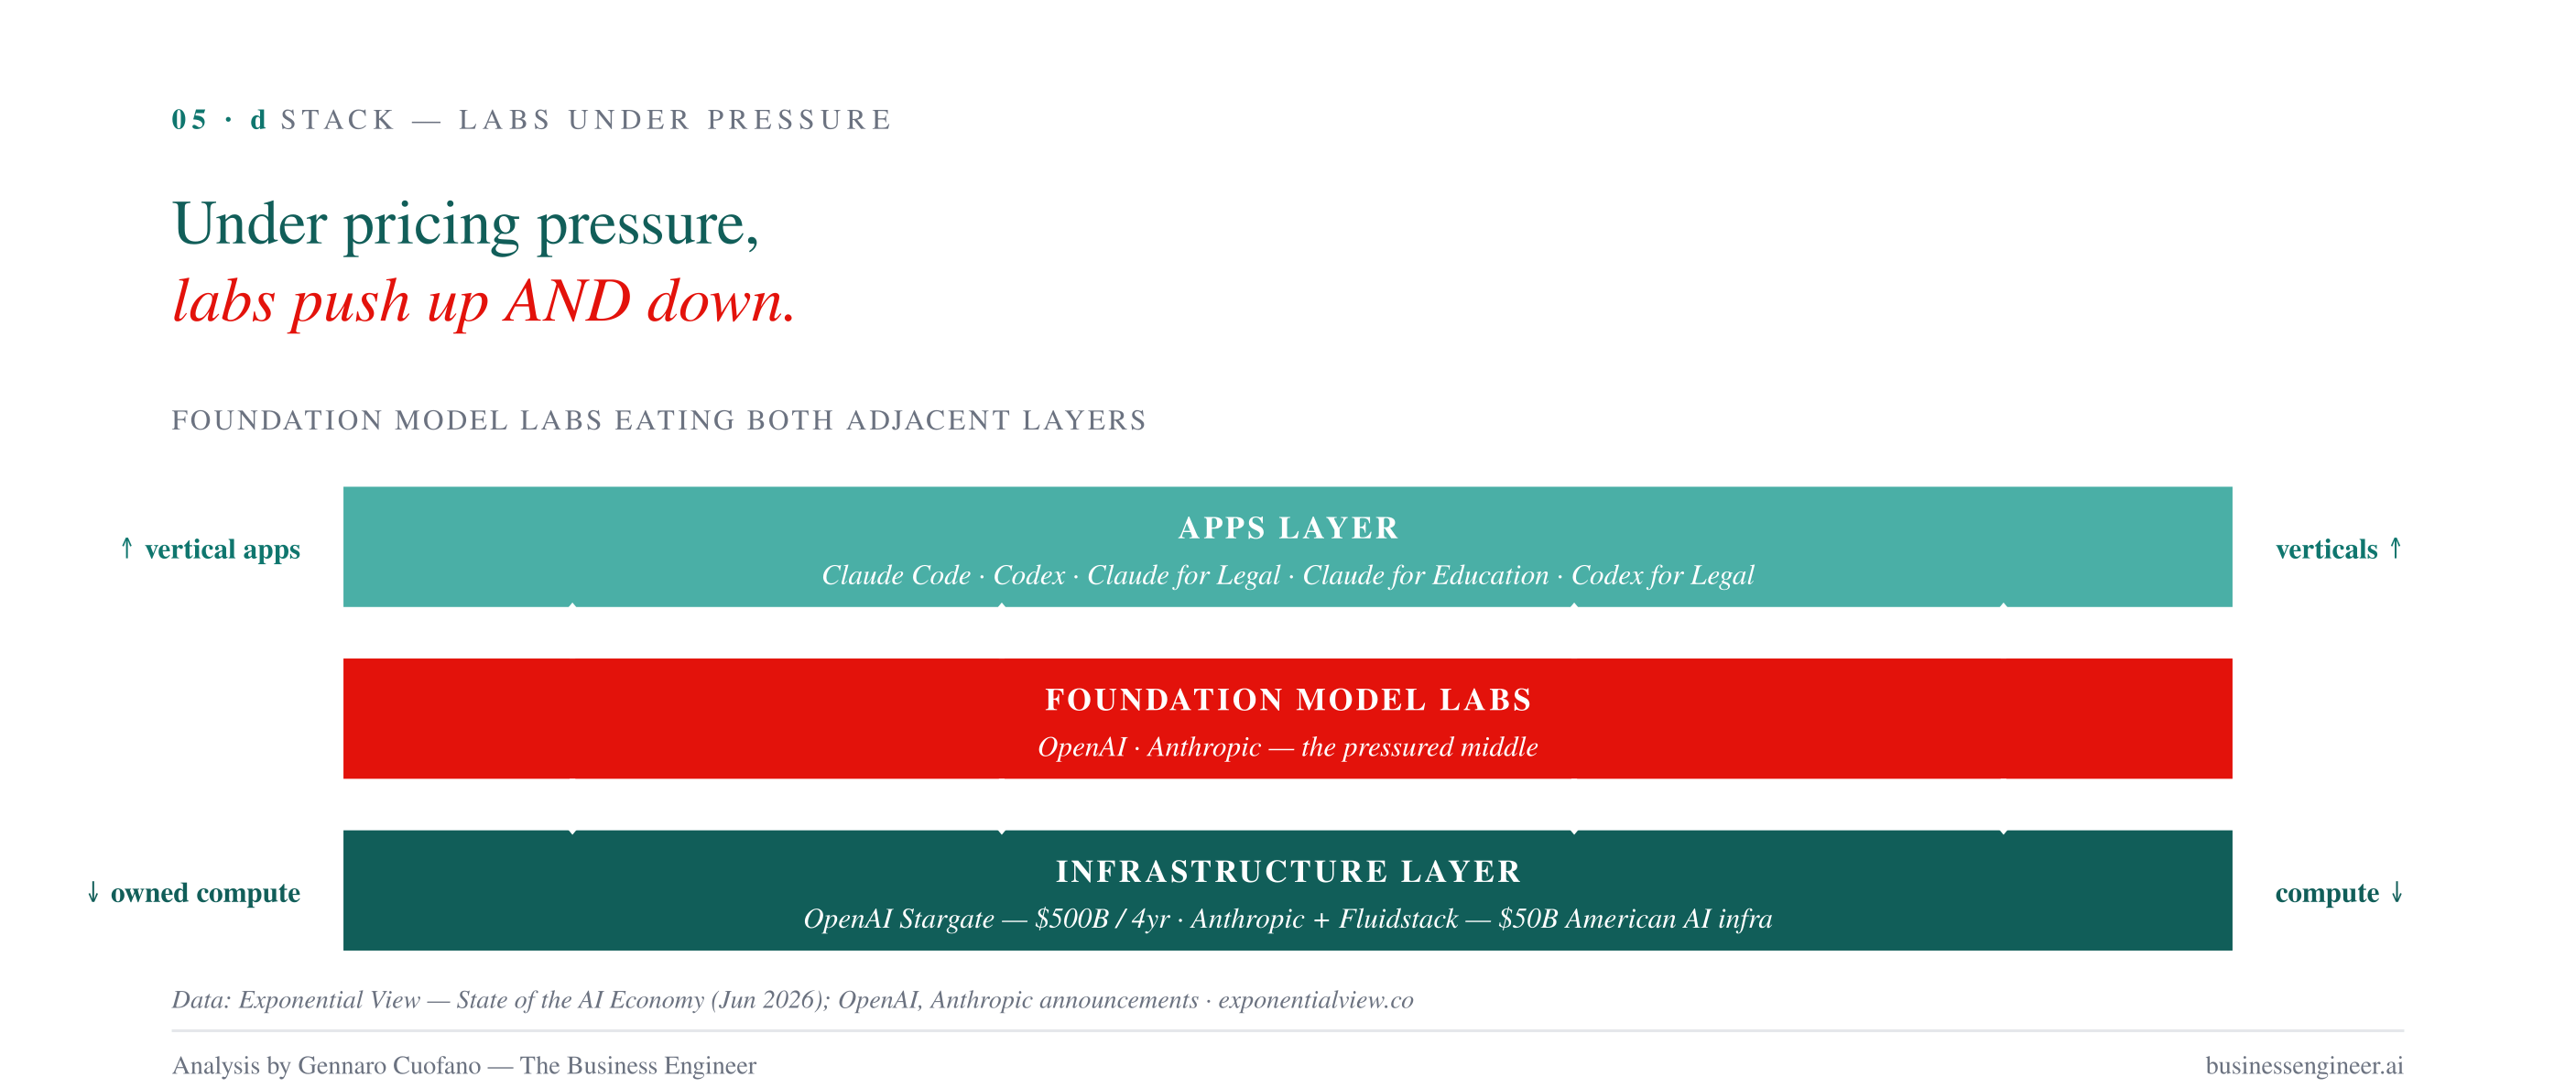
Under pricing pressure, both major labs are pushing into apps (Claude Code, Codex, Claude for Legal, Codex for Legal, Claude for Education) and into infrastructure (Anthropic’s $50B American AI infrastructure commitment with Fluidstack; OpenAI’s Stargate — $500B over four years, $100B deploying immediately). They are trying to occupy both the layer above and the layer below simultaneously, because staying in the middle is where the margin gets squeezed.
Four end-state scenarios worth internalizing
The report closes with four scenarios for how the stack economics could play out. Compressed:
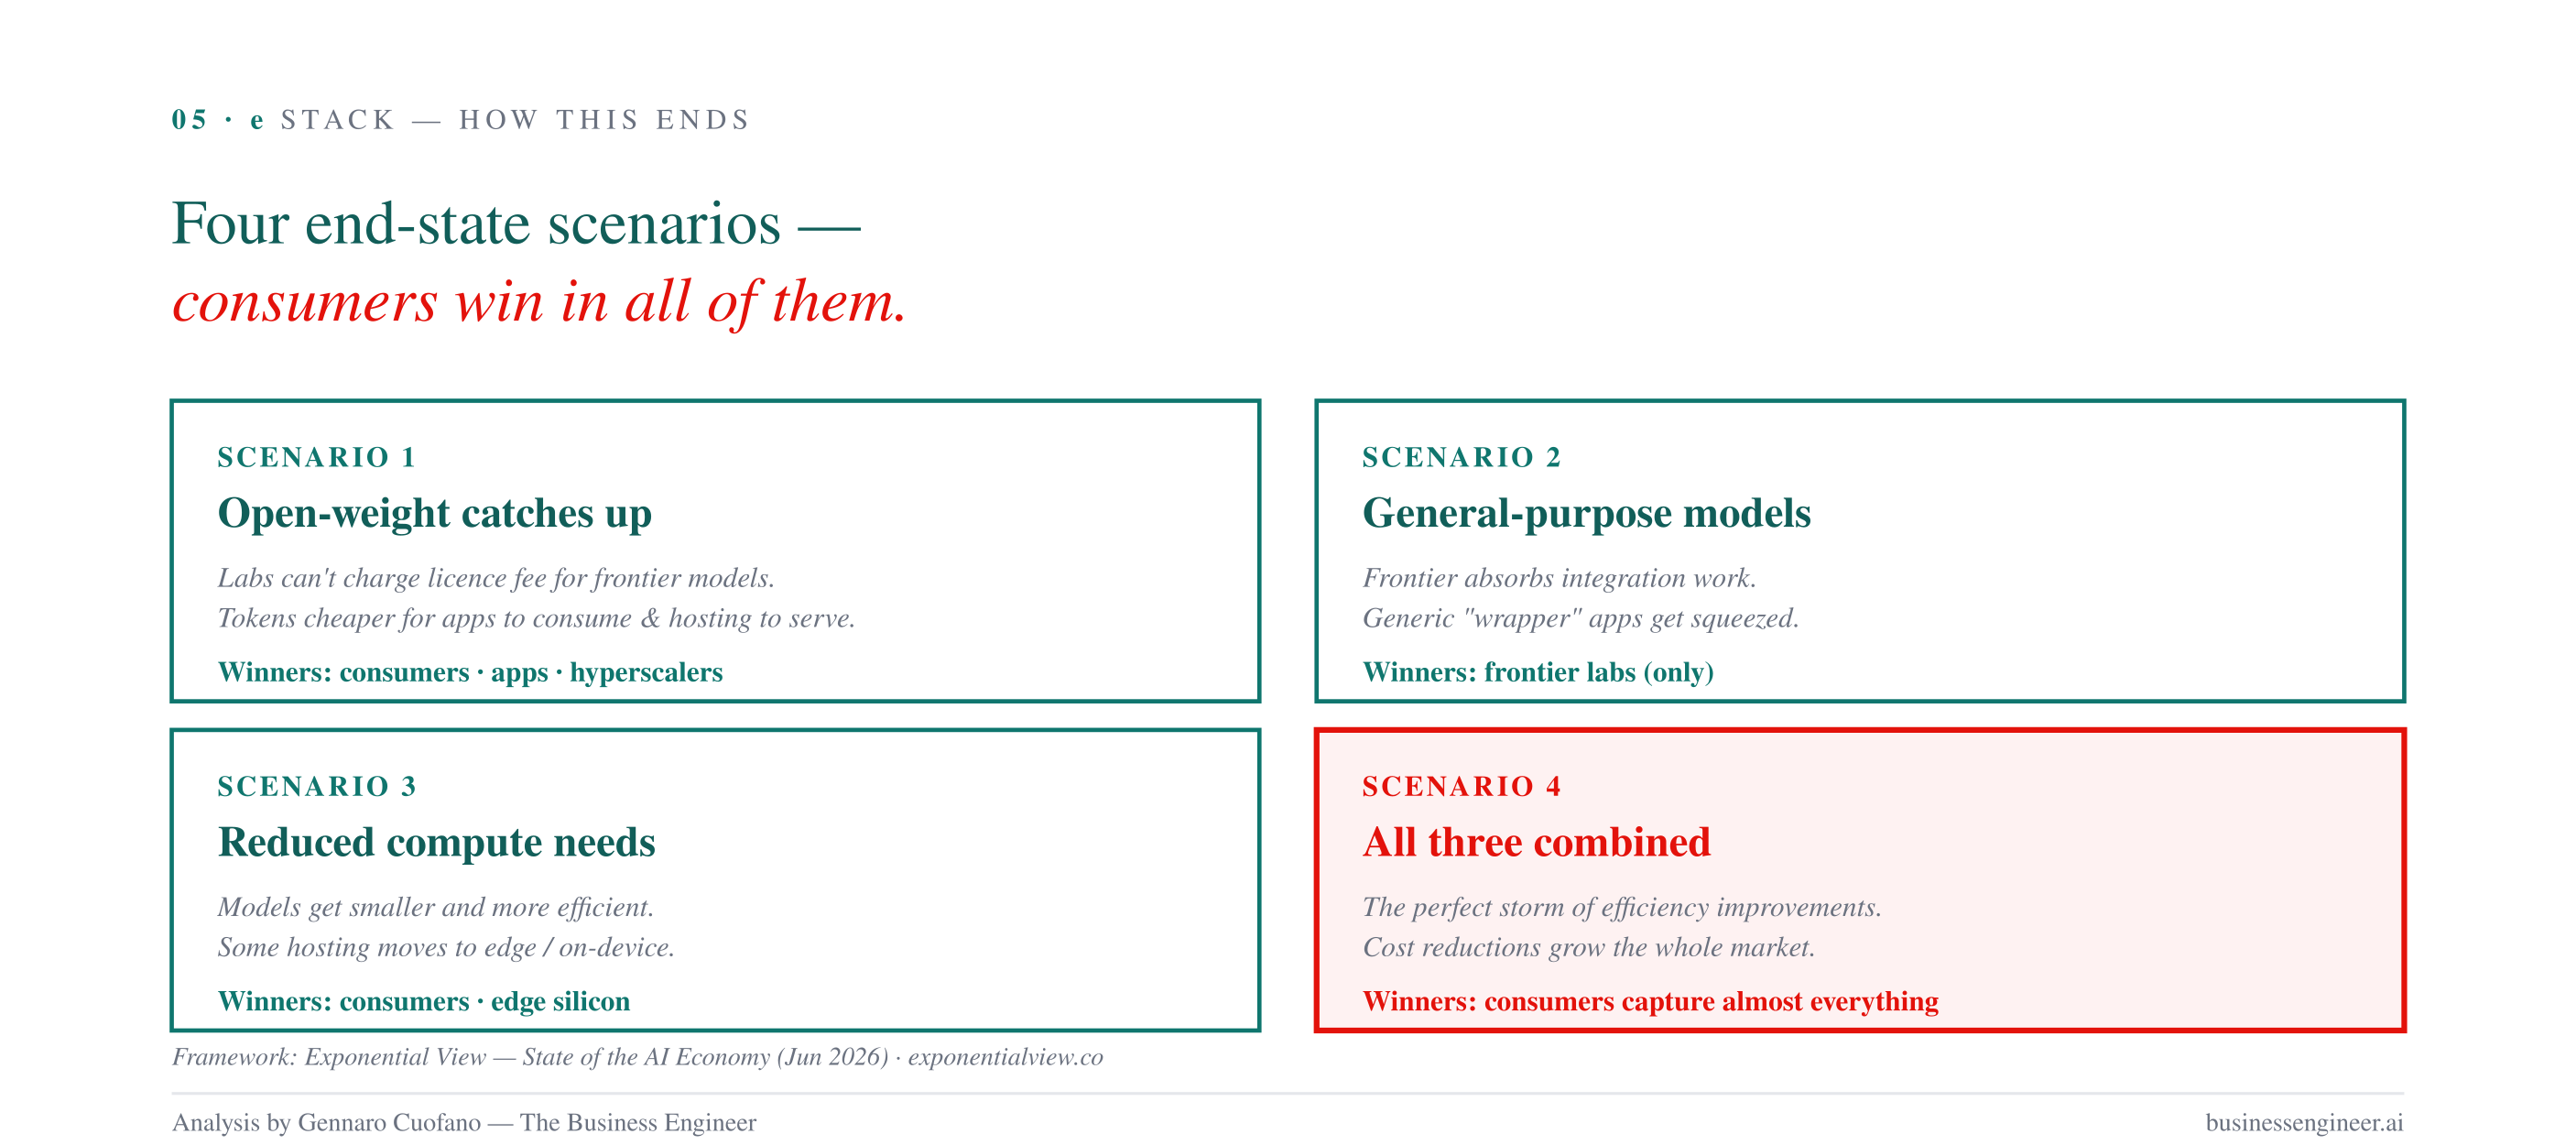
In every scenario, consumers win. In some scenarios, producers also win. In none of the scenarios does today’s revenue distribution across the stack persist unchanged.
That is the underlying structural reality of the AI Supercycle: the stack is not a steady state. It is a distribution being actively contested from both ends.
The Compression: No one in this stack is a static actor. Every layer is trying to eat the layer above it and the layer below it simultaneously. In the AI Supercycle, vertical integration is the default response to competitive pressure — from both directions.
The single sentence that closes the report
Follow me on The AI Supercycle as well!
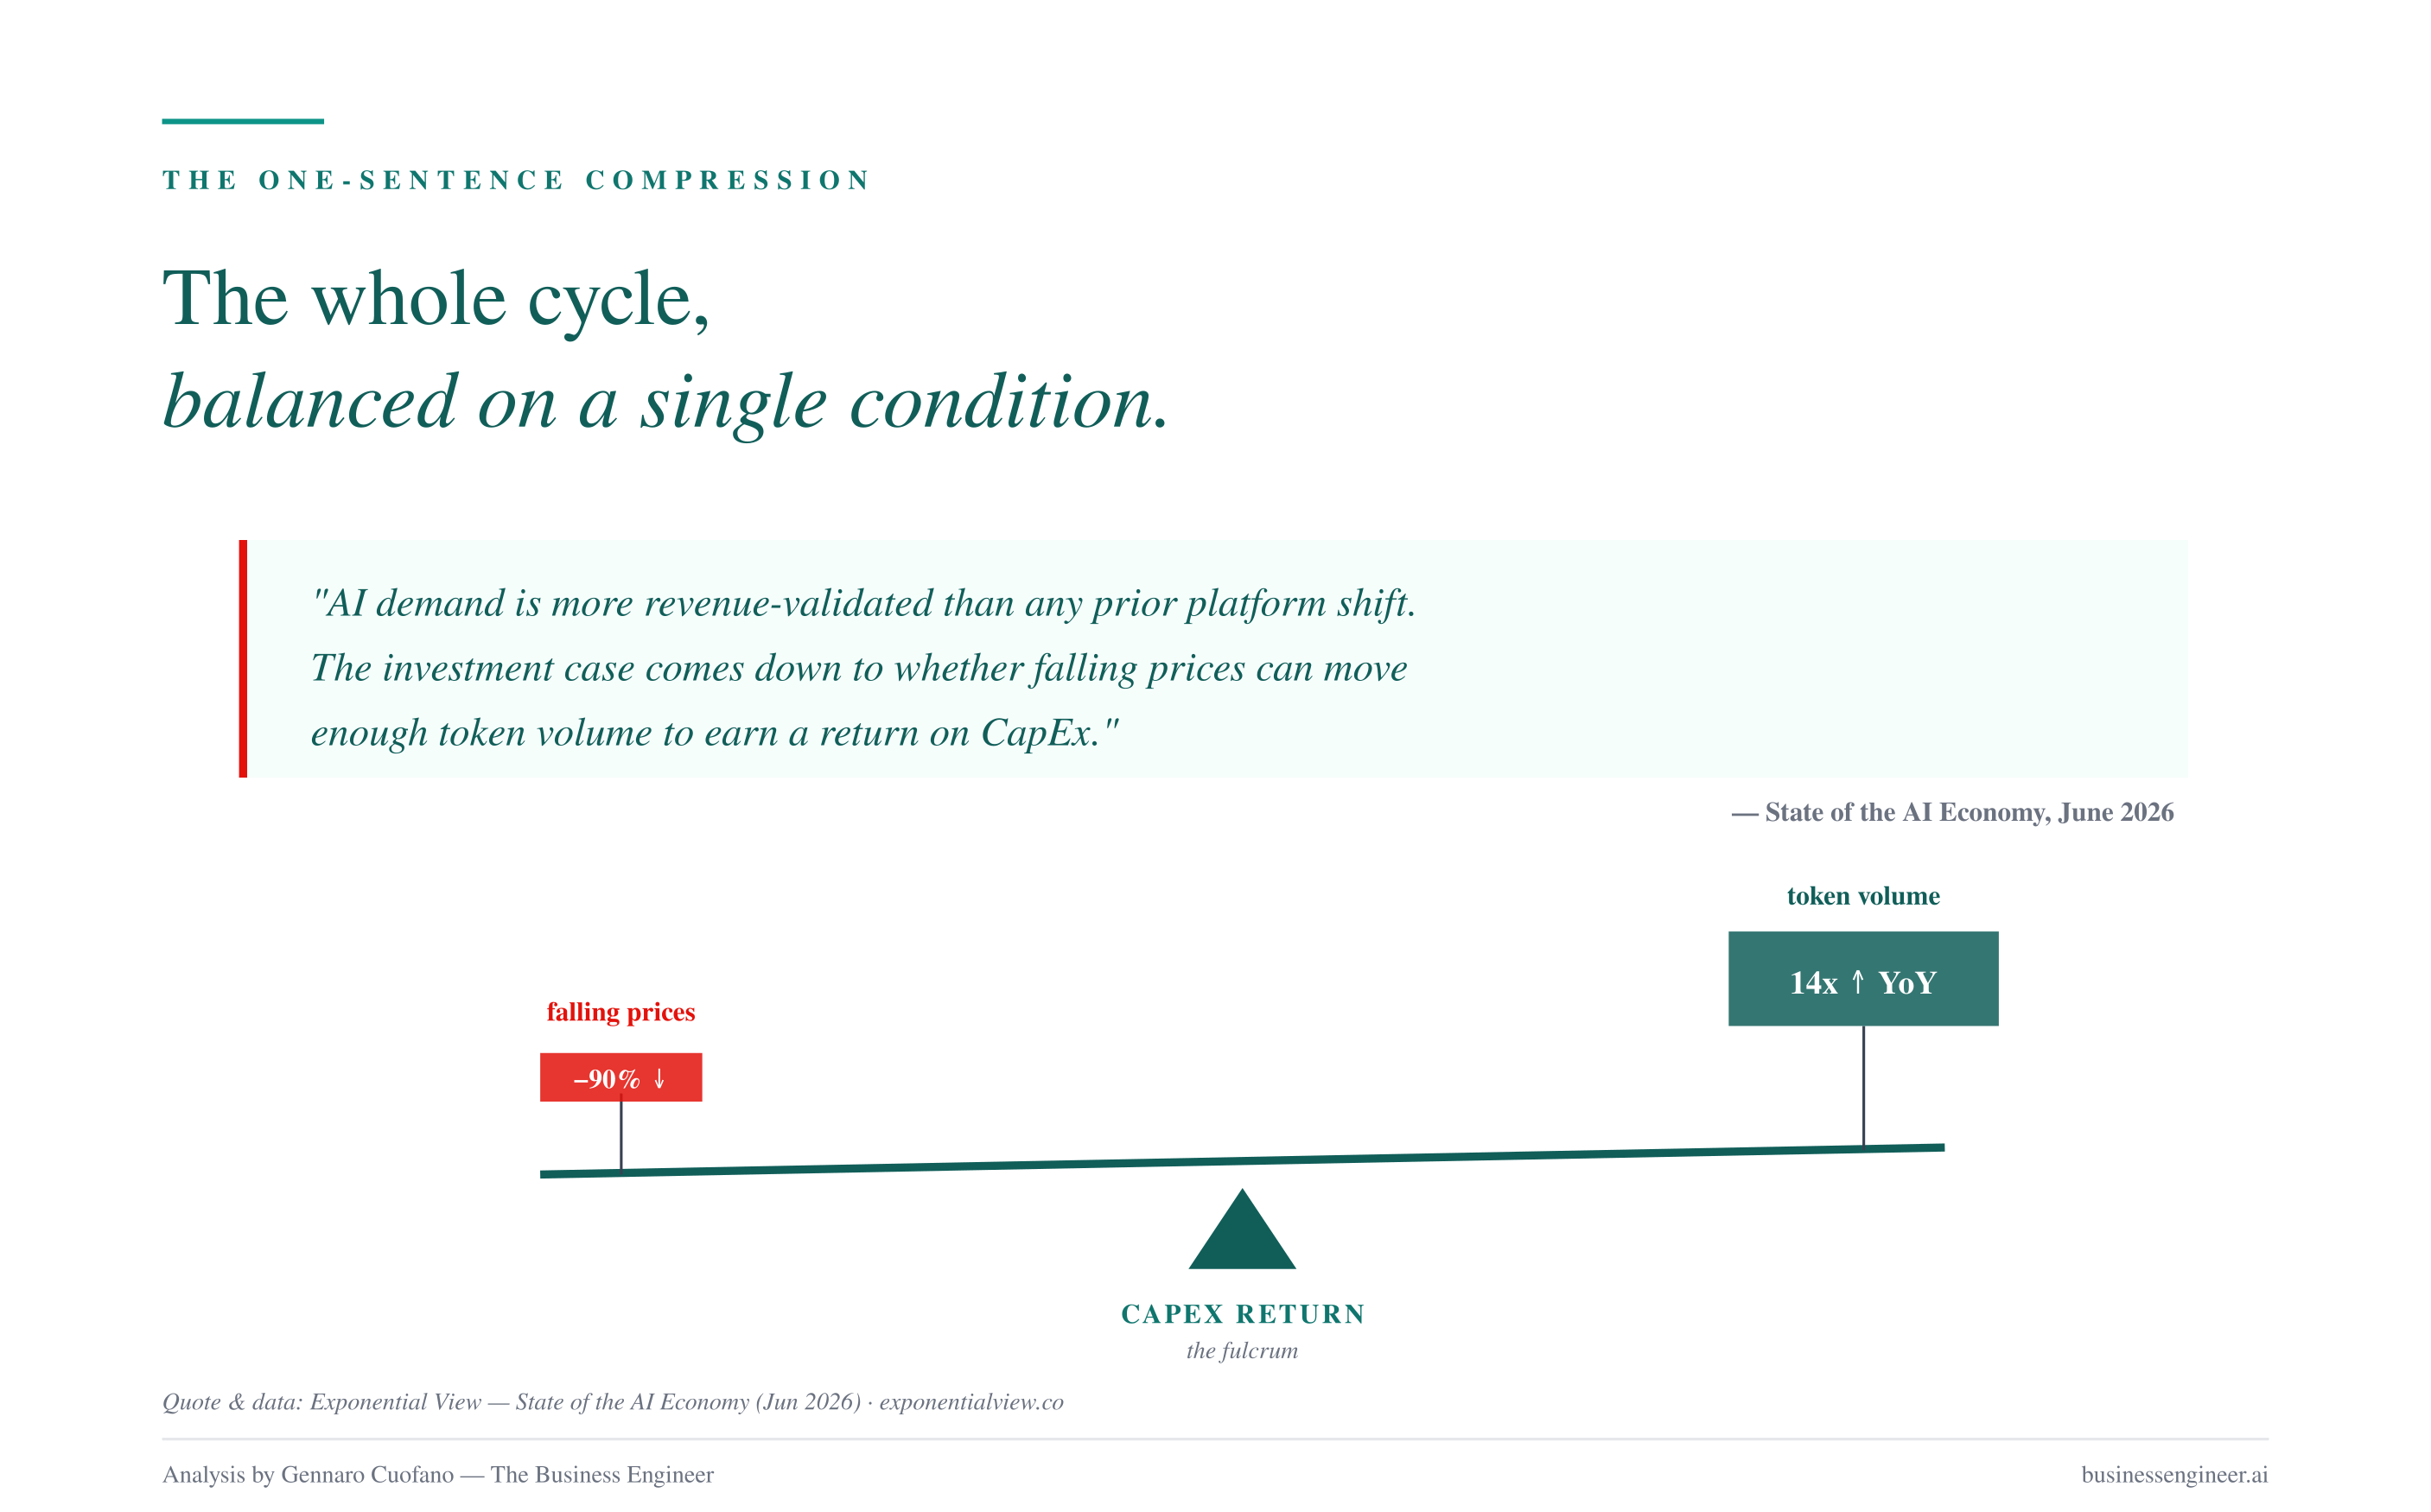
Exponential View ends the whole 60-slide deck with one line, and it’s the right one:
“AI demand is more revenue-validated than any prior platform shift. The investment case comes down to whether falling prices can move enough token volume to earn a return on CapEx.”
That is the AI Supercycle in one sentence. Real demand. Real payback pressure. Collapsing unit prices. Rising volume. Nobody sitting still. The math works — but only if the elasticity holds and the volume keeps compounding.
If you take one thing away from this session, take that sentence.
What This Means for Operators — My Reading
Follow me on The AI Supercycle as well!
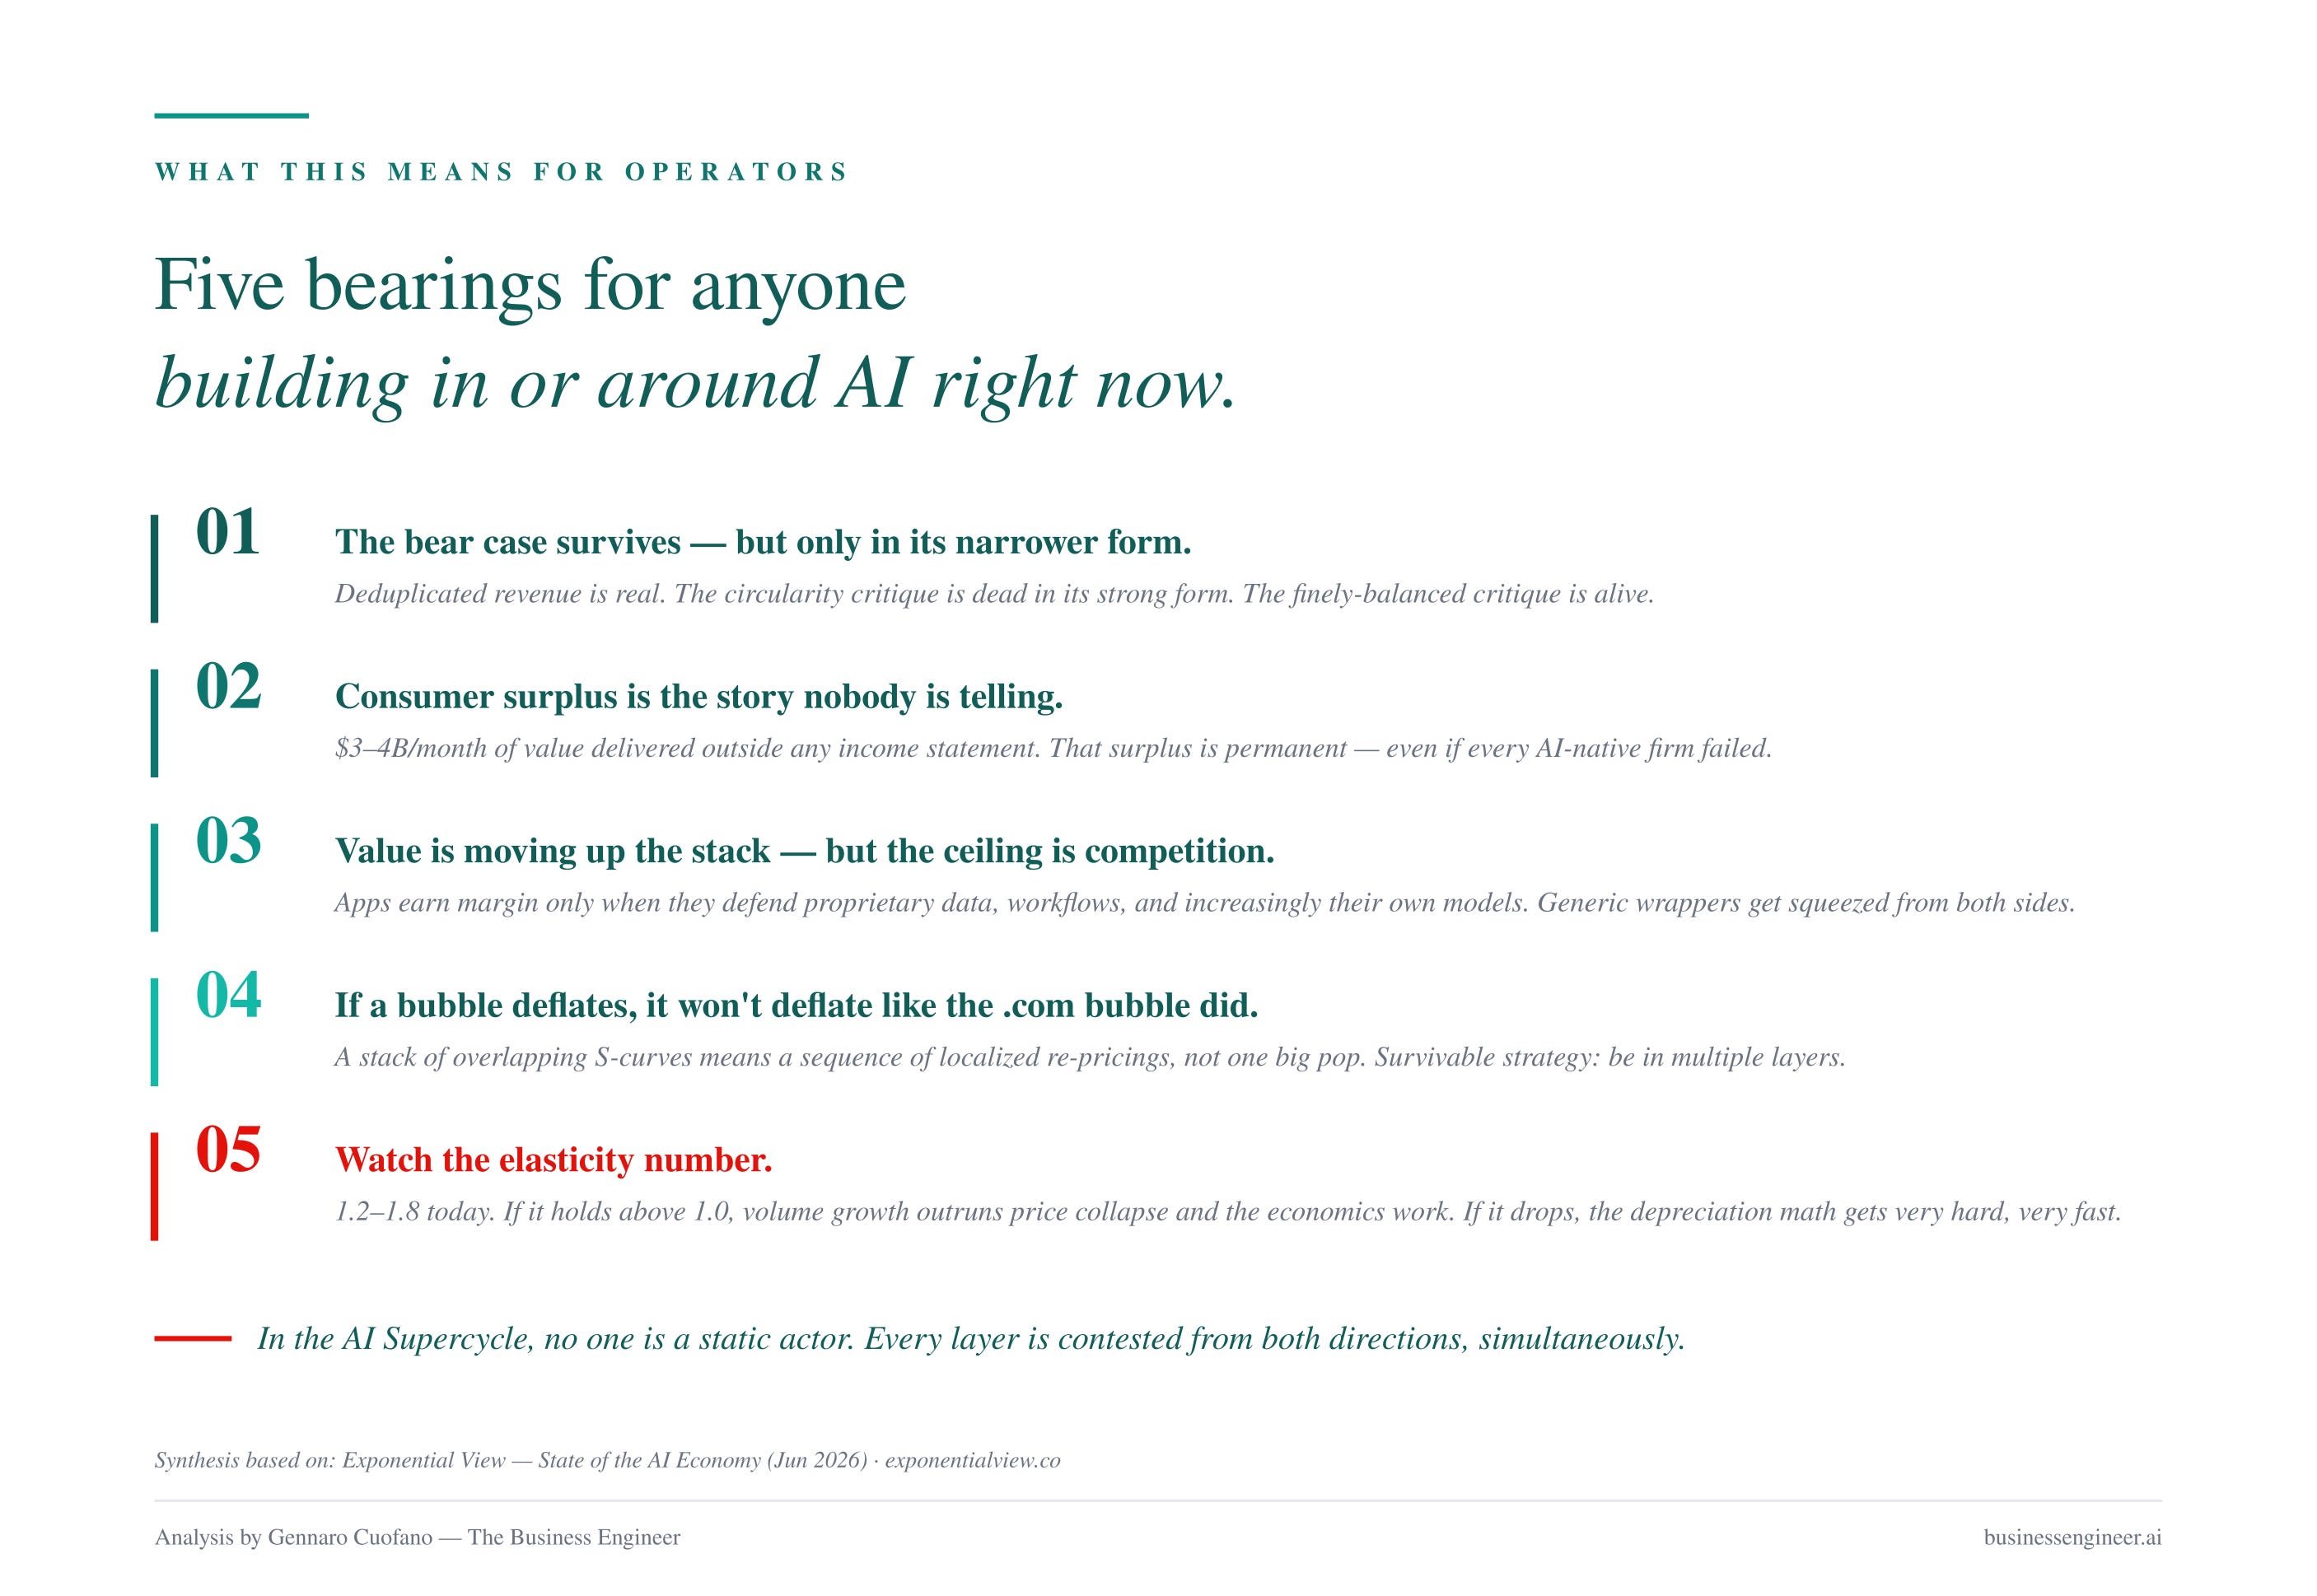
Zooming out from the report and into what I think this means practically for anyone building in or around AI right now:
1. The bear case (”it’s all circular financing”) is dead in its strongest form, alive in a narrower form. Deduplicated revenue is $110B trailing. That’s real external demand. But the depreciation stack is still growing faster than revenue in absolute terms, and external financing is a rising share of the funding mix. The system is finely balanced, not collapsing.
2. Consumer surplus is the story nobody is telling. $3–4B/month of value is being delivered outside any income statement. Even if every AI-native company failed, that surplus is real and permanent. You cannot uninvent knowledge worker productivity.
3. Value is moving up the stack, but the ceiling is competition. The app layer will earn margin — for the specific players who can defend proprietary data, domain-specific workflows, and increasingly, their own models. Generic wrappers are being squeezed from above by Claude Code / Codex-style lab-native apps, and from below by cheaper open-weight tokens. The middle is the hardest place to stand.
4. The bubble, if it deflates, will not deflate the way the .com bubble did. This is a stack of overlapping S-curves — chips, energy, models, apps, agents — each with its own bottleneck, its own capital demand, and its own timeline. What we’ll see is a sequence of smaller, localized re-pricings, not one big one. Which means the survivable strategy is to be in multiple layers, not just one.
5. Watch the elasticity number. The 1.2–1.8 elasticity is the single most important economic variable in the whole cycle. If it stays above 1.0, volume growth outruns price collapse and the industry economics work. If it drops below 1.0 — because agentic workflows saturate, or because open-weight competition compresses the frontier premium too fast — the depreciation math gets very hard, very quickly.
Recap: In This Issue!
AI demand is real and accelerating
Deduplicated GenAI revenue reached $110B TTM, running at an annualized pace of roughly $175B.
Revenue is growing significantly faster than previous technology waves, including the internet, cloud, and mobile.
AI adoption is compounding on top of existing infrastructure (cloud, internet, payments, software), dramatically compressing adoption timelines.
Revenue quality is stronger than many assume
The report removes double-counting across the AI stack (applications, model providers, cloud infrastructure).
Instead of counting the same dollar multiple times, it attributes revenue to where value is actually created.
This challenges the narrative that AI revenue is largely circular spending within the ecosystem.
The AI economy is still in its infancy
Despite explosive growth, GenAI revenue remains a very small share of the broader economy.
Most enterprise AI spending is still focused on productivity improvements rather than revenue generation.
The report suggests the current opportunity is much larger than today’s measured revenue implies.
Consumer value exceeds measured revenue
AI is already creating substantial consumer surplus that does not appear in GDP or corporate financial statements.
Users receive significant value from AI tools without directly paying for it, similar to what happened with Google Search and other internet services.
The economic impact of AI is therefore larger than current financial metrics suggest.
The AI infrastructure buildout remains justified—for now
AI infrastructure investment continues at an unprecedented pace.
Current revenue generation is now covering annual depreciation costs for infrastructure, indicating that the investment cycle remains economically sustainable.
The key risk is whether demand continues to compound fast enough to absorb future capacity.
External financing is becoming more important
Early AI infrastructure expansion was largely funded by hyperscaler cash flows.
Increasingly, debt, leases, and external capital are funding incremental investment.
This creates greater financial interconnectedness and increases systemic risk if AI demand slows unexpectedly.
Tokens have become the economic engine of AI
Token volumes continue to grow exponentially while token prices continue to fall.
Demand has remained highly elastic: lower prices generate proportionally more usage.
As long as token consumption grows faster than prices decline, industry revenues can continue expanding.
Agentic AI changes the economics
Autonomous agents consume orders of magnitude more tokens than traditional chatbot interactions.
Multi-step reasoning, planning, memory, and tool use dramatically increase inference demand.
Agentic AI is therefore expected to become a major driver of compute consumption over the next several years.
Value is gradually moving up the stack
Today, NVIDIA and infrastructure providers capture most of the economic value.
Over time, a growing share of value is shifting toward foundation models and application developers.
This mirrors previous technology cycles, where value progressively migrated from infrastructure to software.
Competition is increasing across every layer
Open-weight models are rapidly eroding pricing power for older frontier models.
Frontier labs are responding by expanding both upward into applications and downward into infrastructure.
Every participant is attempting to vertically integrate to defend margins.
The critical variable is elasticity
The report concludes that the AI investment thesis depends on one central question:
Can falling token prices generate enough additional demand to offset the enormous capital invested in AI infrastructure?
If token demand continues growing faster than prices decline, the economics of the AI supercycle remain intact. If elasticity weakens materially, pressure will build across the entire AI ecosystem.
With massive ♥️ Gennaro Cuofano, The Business Engineer