
There are three ways to read the AI economy, and most people only use one of them.
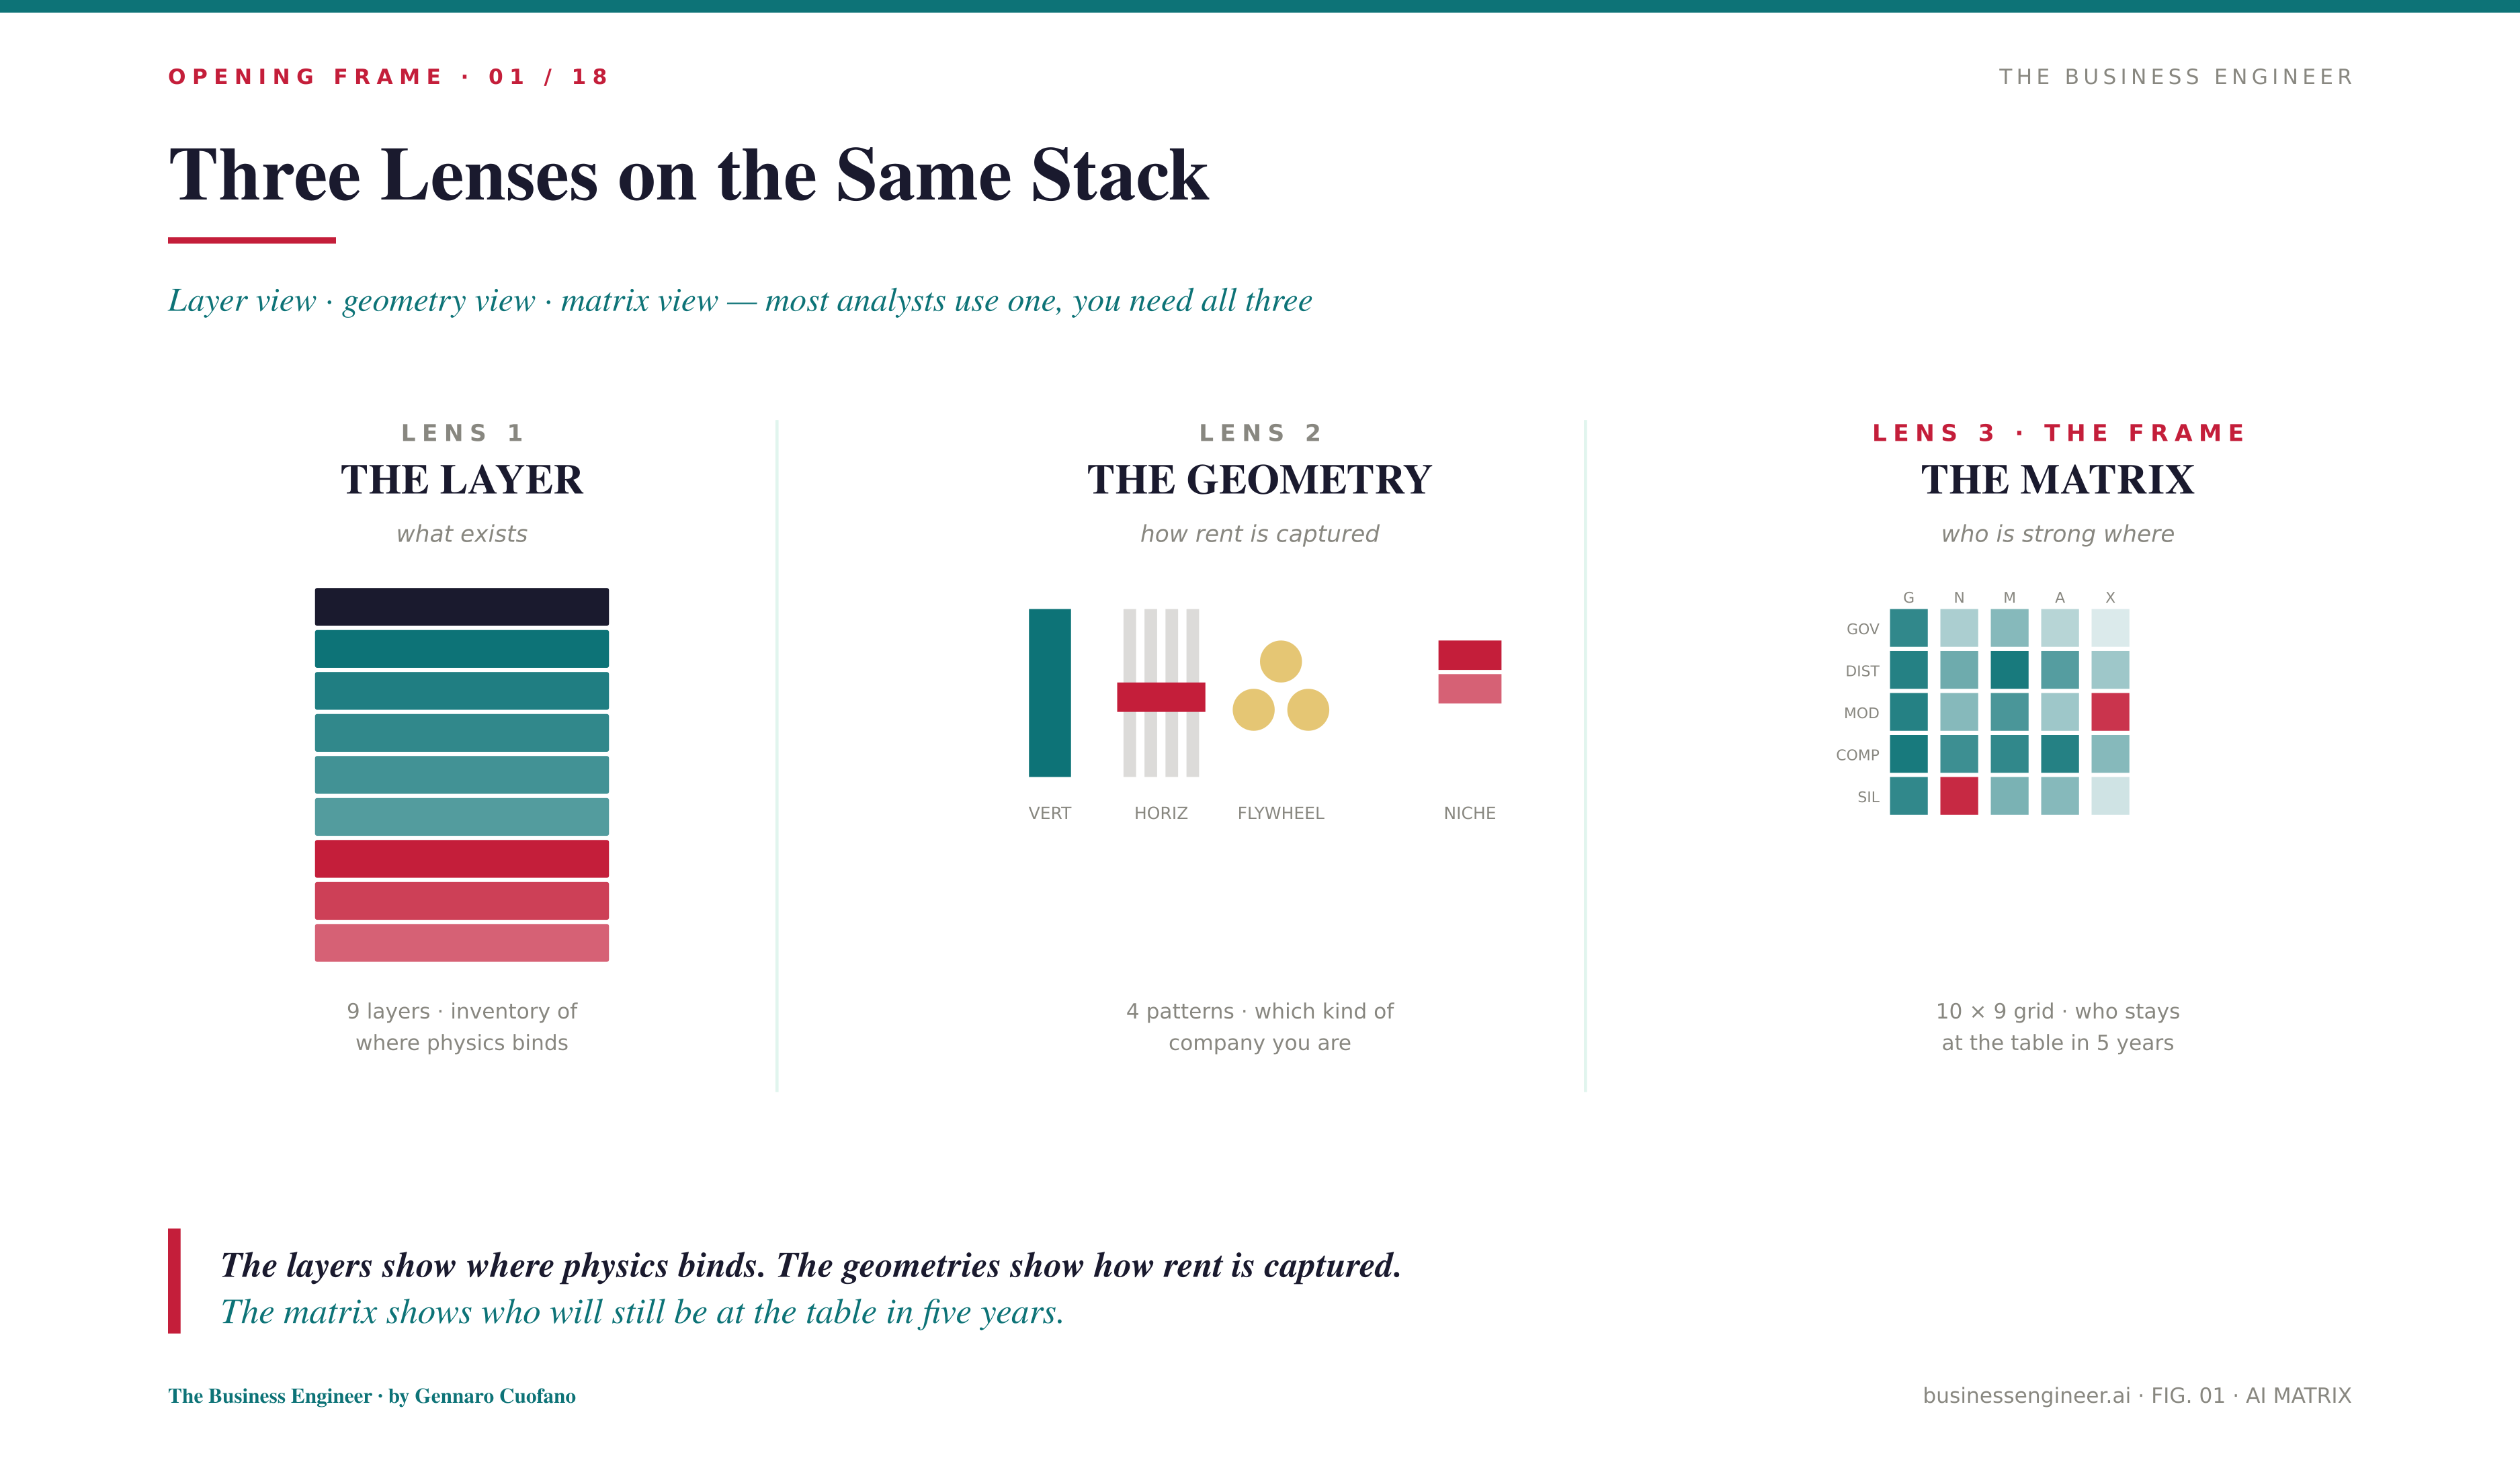
The first is the layer view — the stack from energy to governance, with a bottleneck on every floor. It tells you where physics binds, where capital cannot solve the problem, where time is the only variable. This is the view that dominated the discourse for most of 2024 and 2025.
The second is the geometry view — the three (and a half) patterns of rent capture across that stack. Vertical, horizontal, flywheel, and the niche-by-adjacency play that the small winners use to beat the giants on their own ground. This view tells you what kind of company you are looking at, not just which slot it occupies.
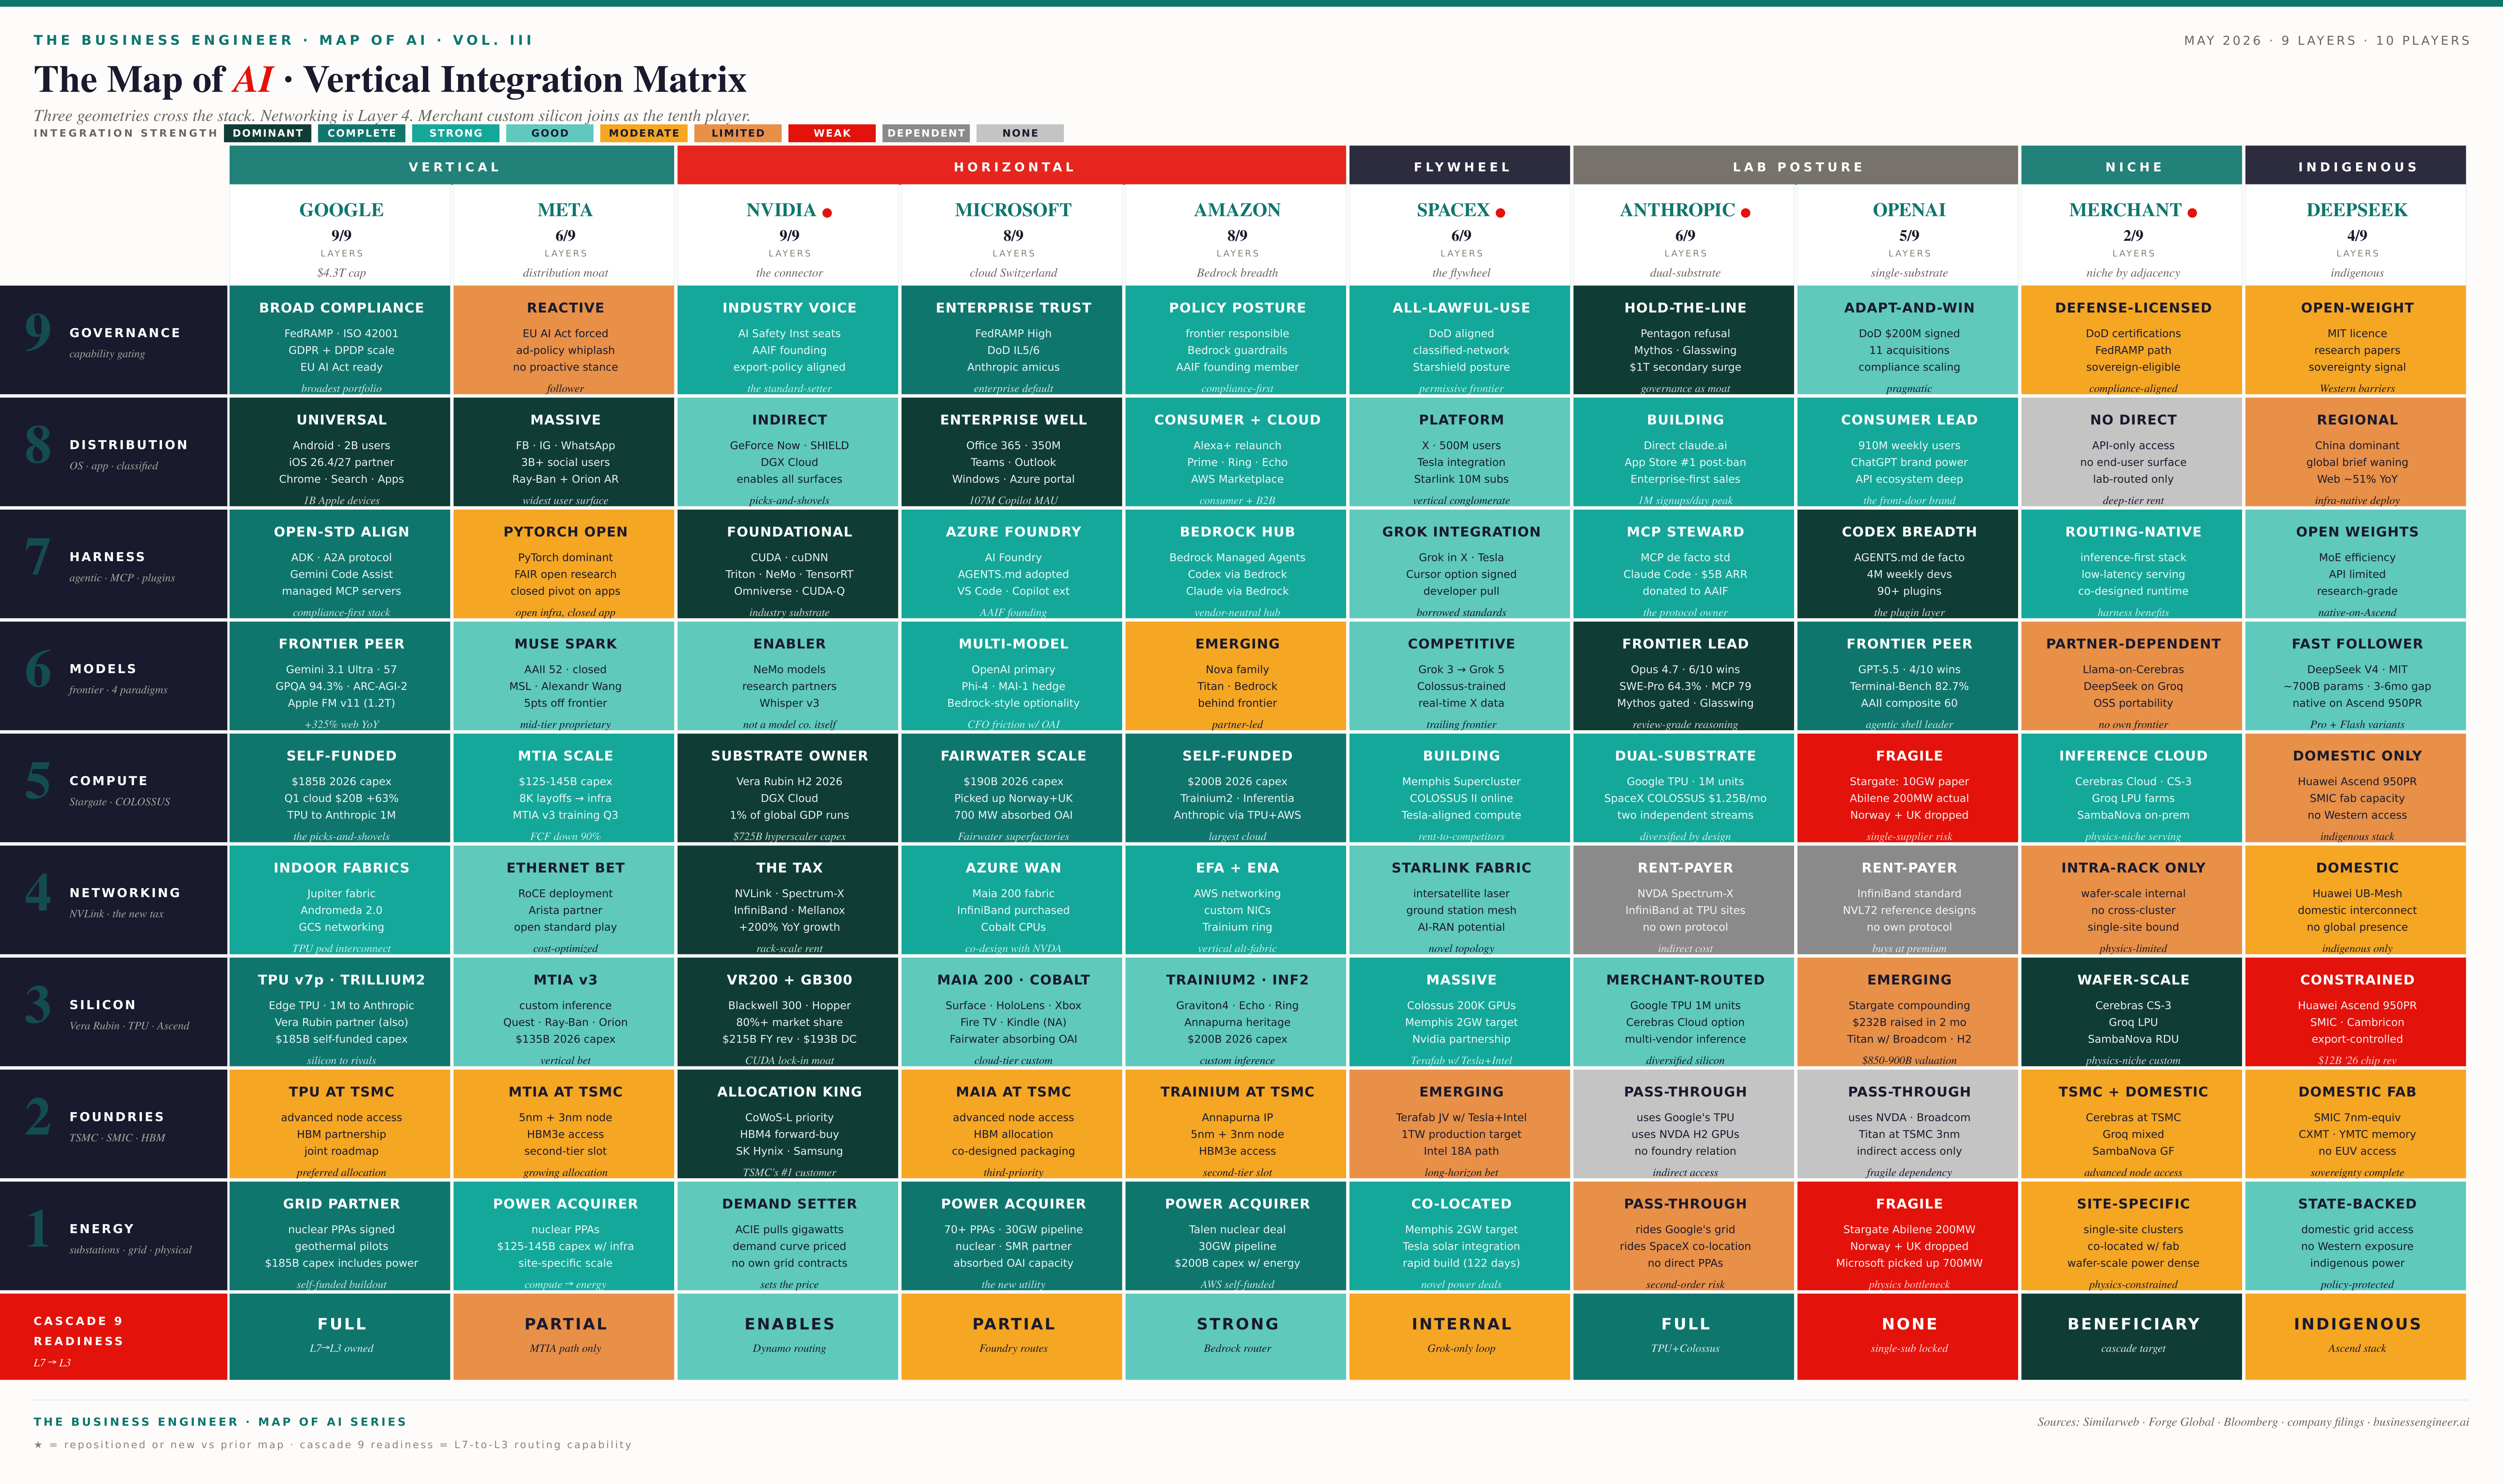
The third — and the one this piece is built around — is the matrix view. You score every relevant player across every layer of the stack, on a scale from absent to dominant. What emerges is not a list of competitors; it is a heatmap of who can actually deliver what, today. The matrix is the only view that surfaces the gaps each player must fill, the dependencies they must accept, and the partnerships they are quietly being forced into.
The layers tell you where the physics is. The geometries tell you how to capture rent. The matrix tells you which players will still be at the table in five years, and what they will be willing to trade to stay there.
Three layers of analysis, in the Business Engineer format: the abstraction (why a matrix view), the market map (the matrix itself), the playbook (the cascades it reveals), and what comes next.
For Premium Members: